In part 1 of this series, I described several tools that can help authors and publishers gather and analyze data relating to their e-book releases. Now what? In this post, I am going to describe how metrics can be used to inform product and marketing decisions. I’ll wrap up with some examples from my company, which publishes “In 30 Minutes” guides.
At a very basic level, it’s possible to correlate available metrics with specific events. For instance, if App Annie shows a sudden spike in refunds for your top seller beginning two months ago, or a rise in your category rankings, consider what could have caused the change. Did you introduce a new edition, or did you get a plug on a national radio or TV program? Is your e-book subject to seasonal sales or drop-offs?
Of course, when considering an event or trend in the data, such as a spike in sales or a plateau in category rankings, multiple factors may be responsible. It’s also possible that specific causes may be unknown to you — Amazon reveals very little about how its search engine works, and does not announce when it tweaks its algorithms.
In addition, when trying to interpret data, it’s vital to keep in mind the adage, “correlation does not equal causation.” Assumptions can sometimes lead you down the wrong path, and lead to decisions that have the opposite of the intended effect.
The cover experiment
Beyond passive interpretation of the data, it’s also possible to take an experimental approach. Testing a new product or marketing campaign and measuring the results can yield insights and help authors identify opportunities. It doesn’t have to be complicated — just make a single change to a title on sale, and then look at the daily sales figures, category rankings, and other data to measure the impact. Elements that can be measured include:
- Price changes
- New marketing campaigns or promotions
- Changing descriptions, categories, or other metadata
- Changes to cover art
One early experiment involved changing the cover of one of my titles from DIY art to a professionally designed cover. Using Google Sheets, I tracked daily KDP sales and Amazon category rankings before and after the switch, and observed an aggregate 50 percent increase in daily sales in the weeks following the change, as well as a corresponding rise in the overall ranking in the Amazon Kindle store. This convinced me to use professional design services for all future titles. You can see the before and after images for “Dropbox In 30 Minutes” below:

I’ve used the same designer for all “In 30 Minutes” titles since that experiment. There is a cost associated with using a professional designer, but the measurable sales boost is worth it.
Using metrics to turn around a failing title
And then there’s the flop I mentioned in part 1 of this series. After a string of successful releases of “In 30 Minutes” guides, I released a new title that explained how to use spreadsheet programs like Microsoft Excel. For the first three weeks there were no sales. What was wrong, and how could I fix the problem?
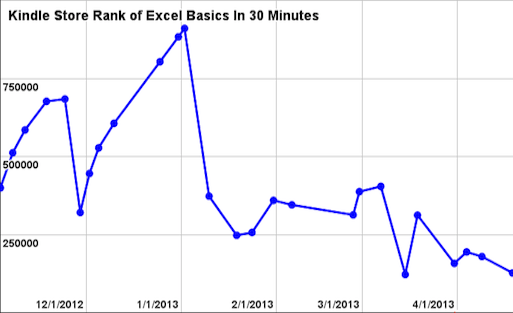
I immediately decided to carry out a series of experiments, and measure the results. The chart below shows the Kindle Store rank of the title from early November through the spring:

Each one of the blue dots represents a new data point. The higher the value, the worse the ranking in the Kindle store. On each date, I often implemented a specific product or marketing action, or attempted to measure the impact of the last change. Here are some of the events:
Nov. 3: Released “Spreadsheets In 30 Minutes.”
Nov. 7: Changed name of guide to “Excel In 30 Minutes.”
Nov. 18: Still no sales.
Nov. 24: Changed title to “Excel Basics In 30 Minutes.”
Nov. 29: First sale recorded. Minor metadata changes implemented.
Dec. 12: Dropped price to $5.99.
Dec. 25: No further sales since price change.
By the end of 2012, things were looking dire. There had been practically no sales in two months. The Kindle Store ranking was approaching 1 million, which any author or publisher knows is not a good place to be.
Then some of my marketing experiments began to yield results. In early January, I implemented a significant metadata change, including updating the description and changing the categories. All of a sudden, the title started to sell. I couldn’t be sure that the metadata change was solely responsible, but something was making the book more noticeable or appealing to Amazon.com users.
In the early spring, I started a Goodreads Giveaway. In the first week that the promotion was active, I observed a spike in sales. I was far more confident that there was a connection between the giveaway and the new sales, because I had new metrics to work with — the Goodreads data that showed the number of people who signed up for the promotion as well as the new “to-reads” as hundreds of people added the title to their reading lists. I assumed that some potential readers couldn’t wait for the promo to end, and went over to Amazon to buy the guide.
This data not only showed that sales were picking up, it informed many of the marketing and product decisions that followed. For instance, every title I have released since January has included a Goodreads Giveaway as part of the launch marketing. I have observed a similar mini sales boost each time I have launched a Giveaway.
Taking e-book metrics to the next level
What does the future hold for metrics in the e-publishing industry? I look forward to App Annie and other third-party services expanding their metrics offerings to include data from Nook Press, CreateSpace, and other platforms. I also hope platform owners can expose new data via APIs or other mechanisms to allow authors and publishers to get a better understanding of how readers are using e-books. Which chapters are they reading, and which chapters are they skipping? Where in the books are they adding bookmarks or annotations, or zooming in on images? What links are being clicked? What other sorts of engagement are taking place? This type of data is already available to app developers through tools such as Flurry and Localytics, and help developers improve content and user interfaces. As e-books become more app-like, authors can use this data to make better reading experiences for their audiences — and help improve sales.
If you’re an independent author or publisher, how do you use metrics? Share your thoughts in the comments section below. I will try to answer questions as they come up.
Part 1: How to Track E-Book Sales with App Annie, Google Sheets
Ian Lamont’s media career started more than 20 years ago and spans three continents. It includes a stint in the British music business and a six-year residence in Taipei, where he learned Mandarin, worked for a local TV network and newspaper, and started a hard-rock band. He was the senior editor, new media for IDG’s Computerworld and served as the managing editor of The Industry Standard. After graduating from the Sloan Fellows program at MIT, Lamont founded two start-up ventures, including a mobile software company and i30 Media, which publishes In 30 Minutes® guides. In his free time, he loves spending time with his family, geeking out on genealogy, and improving his Chinese cooking skills (he cooks a mean 三杯雞!). Follow him on Twitter at @ilamont or email him at [email protected].
