Late last year, my publishing company released a dud. After a string of successful releases of “In 30 Minutes” technology guides, this new title had absolutely zero e-book and sales in the first three weeks of release. None. Nada. 沒有.
As a small, bootstrapped operation, my company could have written it off as an embarrassing flop and moved on. But that’s not how I roll. Not only was I curious about what went wrong, I also needed to find a path to sales. So I employed an approach that has served me well in the world of digital media: I launched a series of product and marketing experiments, backed up by metrics.
If you’re a self-published author or a small publisher, how well do you know your metrics? Don’t worry if you don’t know much, or only use metrics for basic tracking purposes. In part 1 of this two-part series, I am going to share some tools that can help you tame your data and leverage metrics for better decision-making. In part 2, I’ll share some insights gleaned from my own experience publishing a series of how-to guides, and how data has helped me make better-informed decisions about product development, marketing and distribution.
Basic Metrics And The Excel Gap
Most authors who publish on Amazon’s Kindle Direct Publishing platform have a good idea of their current monthly sales totals, as well as the sales and category rankings for each of their titles. Judging by some of the discussions I see on author forums and blogs, some authors religiously follow their daily stats. Authors also monitor the current sales figures from Apple’s iTunes Connect, Nook Press, Kobo, CreateSpace, and other self-publishing and print-on-demand (POD) platforms.
But it’s much harder for authors to identify trends over longer periods of time, or leverage metrics in other ways. This is not because of a lack of data. All self-publishing platforms offer basic sales figures and make older data available for download. The problem: The presentation of current data tends to be poor and the data downloads — usually spreadsheets that require a working knowledge of Microsoft Excel — are hard to work with. Even Apple, which has created industry-changing user interfaces for desktop computers and mobile devices, can only offer authors a simple bar chart showing daily sales on iTunes Connect (see screenshot, below). Monthly revenue is available in downloadable CSV (comma-separated value) format — but there are separate files for separate countries, and authors have to do the currency conversion on their own.

App Annie
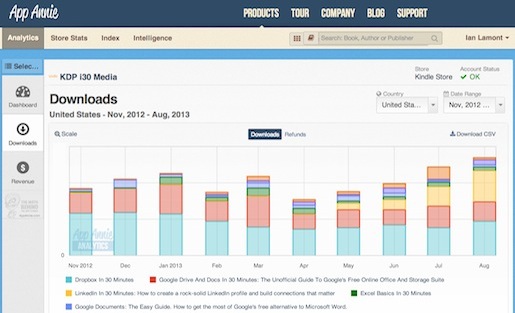
Fortunately, there is a new tool that allow sales, revenue, and even ratings or review data to be aggregated, analyzed, and leveraged for marketing campaigns, product updates, and other business decisions. App Annie, which offers a metrics tool for developers of iOS and Android Apps, recently released a tool aimed at the e-book market. Authors and publishers who create a free account and share their KDP and iTunes Connect login credentials are able to get a long-term view of sales and revenue, which can then be sliced and diced by title and market:

App Annie gives insights into other metrics, as well. Amazon ratings and reviews are aggregated for each title, and it’s also possible to see rank history, daily ranks, and highest ranks reached by title and country.
Importantly, it’s possible to see how other books (including competing titles) are ranking in various categories in different markets. This is publicly available information, but it is very hard to track over time. Sales Rank Express and other online sites provide similar tracking, but the advantage of App Annie is that the data is brought together with your own sales and revenue figures. Here’s the view in App Annie for Malcolm Gladwell’s “Outliers,” which shows rankings data for the United States, the United Kingdom, and Japan:

App Annie isn’t perfect. There are shortcomings:
- Only sales and revenue data from KDP and iTunes Connect are included. Data from Nook Press, CreateSpace, and Kobo cannot be viewed in App Annie.
- There is a lag in the monthly data. For instance, monthly KDP sales/revenue data doesn’t appear until the middle of the following month.
- Authors who are concerned about sharing data with a third-party service may not be satisfied with App Annie’s promise to encrypt the data and “never, ever” share it. Considering the many reports of data breaches involving companies including Dropbox, Facebook, and Apple, there is a legitimate reason to be concerned.
Despite these issues, App Annie is much easier to use than the next tool in my arsenal: Google Sheets, an online spreadsheet program that is part of Google Drive’s free online office suite.
Google Sheets
Spreadsheets have an image problem. Most people assume that programs such as Excel and Google Sheets are intended for accountants, financiers, scientists, and other geeky types. Creating a spreadsheet, sorting data, using functions, and making charts seems daunting, and best left to the nerds.
Not true! Once new users get over the unfamiliar screen layout and commands, basic spreadsheet functions are easy to learn. Learning Excel or Google Sheets is outside of the scope of this article, but if you’re interested I’ve written a how-to guide for Google Drive (which includes Google Sheets) as well as a guide that covers Excel Basics. There are also numerous how-to videos available on YouTube.
For my publishing company, I use Google Sheets over Excel for the following reasons:
- Sheets is free.
- It allows me to access data from any computer I am using, as well as mobile devices.
- I can use it to collaborate with authors, copy editors, designers, and other freelancers.
- I can create online forms based on Google Sheets that make data entry easier for both myself and some of my freelancers.
Unlike App Annie, Google Sheets doesn’t magically display sales or ranking data. It has to be uploaded, imported, or manually copied and pasted from other sources. It then needs to be manipulated, using simple formulas that calculate totals, percentages, discounts, and other important indicators. You can analyze the data just by looking at the raw results in Google Sheets, but it’s also possible to use Sheets’ chart wizard to create visualizations that can aid in interpretation.
Yes, doing all of these things can be a pain. But once you have a spreadsheet set up to gather and process certain types of data, it can be very easy to spot trends, measure the effectiveness of promotional campaigns, and track basic information about your business. I have one spreadsheet that aggregates all unit sales and revenue from all platforms. It was difficult to create (more than 300 rows) but it’s absolutely critical to monitoring what’s going on. Until App Annie came on the scene, I maintained another spreadsheet to measure the impact of specific campaigns, changes to products or marketing, and even the introduction of competing titles.
In the next piece, I’ll talk about how I used Google Sheets to measure the impact of a new book cover. I’ll also reveal how metrics helped me turn around sales trajectory of the flop mentioned at the beginning of this column.
In the meantime, I would be interested in hearing about how other authors and publishers have used Google Sheets, App Annie, or other tools to drive product decisions or marketing. Leave your comments and questions in the space below.
Part 2: How to Boost E-Book Sales by Tracking Marketing Tactics
Correction: This post has been altered to correct that iTunes ranking data is available.
Ian Lamont’s media career started more than 20 years ago and spans three continents. It includes a stint in the British music business and a six-year residence in Taipei, where he learned Mandarin, worked for a local TV network and newspaper, and started a hard-rock band. He was the senior editor, new media for IDG’s Computerworld and served as the managing editor of The Industry Standard. After graduating from the Sloan Fellows program at MIT, Lamont founded two start-up ventures, including a mobile software company and i30 Media, which publishes In 30 Minutes® guides. In his free time, he loves spending time with his family, geeking out on genealogy, and improving his Chinese cooking skills (he cooks a mean 三杯雞!). Follow him on Twitter at @ilamont or email him at [email protected].
