Reporters in four North Carolina counties have a new colleague — a robot that checks public records every day for story ideas and shoots you an email if something shows up that you’ve told it is interesting to you.
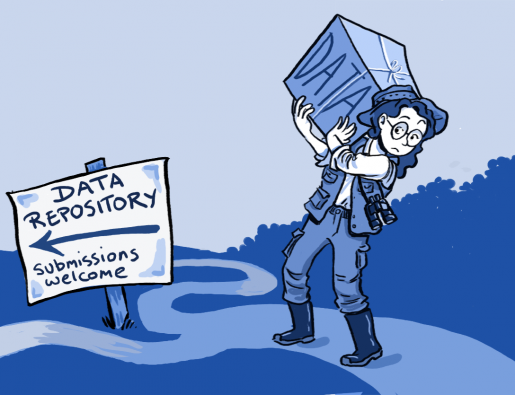
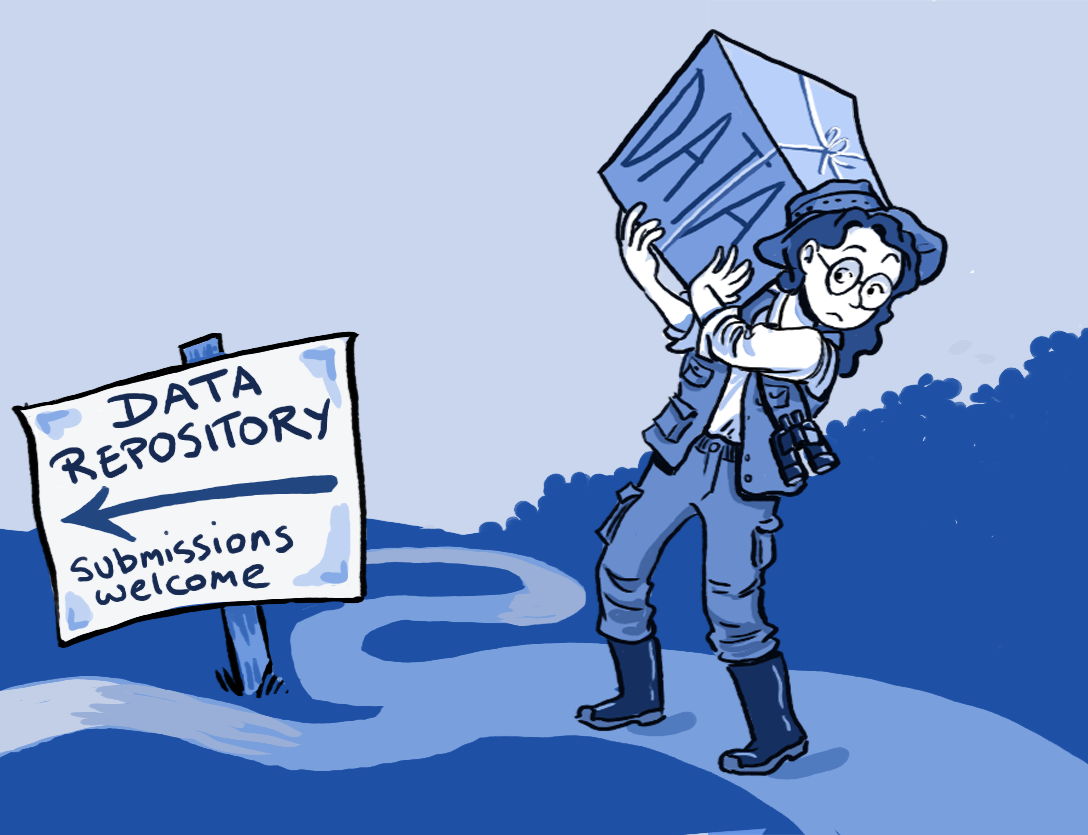
The N.C. Data Dashboard for newsrooms scrapes online police reports and other public data in Wake, New Hanover, Buncombe and Orange counties and makes it available to reporters in one easy-to-use web interface.
Data all in one place
Reporters that used to have to check three or four websites at the city, county and state level to find information on a single person or address can now find a lot of that data in one place.

Reporters can now find a whole lot of data in one place.
For each county, we have some combination police incident and arrest reports, property tax data, real estate transactions, health inspections and voter registrations. We don’t have all the data for every jurisdiction, though. The biggest obstacle that reporters in North Carolina still face is the lack of current, complete, non-proprietary, machine-readable data. While some innovative communities are the exception, if you’re looking for data in a city with fewer than 80,000 people or a county with fewer than about 220,000 there is almost no city or county data available online. That’s more than 60 percent of North Carolina’s population — many of whom live in low-wealth communities that are also without a robust daily news organization and are below average in education.
New ways to search public data

If you wanted to see how many women over age 80 had been arrested in Wake County, for example, you could not answer that question using the government sites.
All of the data we use in the dashboard is downloaded or scraped directly from public government servers, so the data is as complete and as current as the source. But most government websites that post data give users limited options for the ways they can search and sort the data. In Wake County, for example, if you wanted to see how many women over age 80 had been arrested you could not answer that question using the government sites. But on the N.C. Data Dashboard that search is easy — and you can see that Betty White was arrested for marijuana possession back in 2012.
Of course, it’s not THAT Betty White. … I don’t think. Reporters still need to have fundamental skepticism when using this data, just as they should with any source.

Once users find an interesting name in the news — like Betty White — they can create email alerts that tip them off to new story ideas.
But if they do want to keep track of Betty White, or any other powerful person in the community, they can simply do a search for their name and create an email alert with the service. Anytime the name shows up, you get an email. Or maybe they want to know every time an 80 year old woman is arrested, or any time something happens at the home of the mayor or a prominent restaurant — they can set-up email alerts based on those searches as well.
Pssst. This data has a hot tip for ya
The Data Dashboard is more than just a backgrounding or fact-checking tool. It’s an automated tipster that gives reporters ideas for stories. Reporters don’t have to — and shouldn’t — publish every tip they receive, but the Dashboard makes more efficient the job of finding hidden stories, of holding powerful people accountable and explaining trends in communities before they become emergencies.
The Dashboard is also serving as an important historical repository for the communities it serves. In many cases, government data sources only include the most recent snapshot of information, but we’re downloading and holding data so we can detect trends over time.
Even in the few communities where governments do make public data easily accessible, a lot of useful data remains locked up in PDFs. We’re working on that problem as well. An undergraduate computer science student at UNC has written a program that locates and extracts data out of PDF police reporters in about two dozen jurisdictions in North Carolina. When that comes online, the reporters using the Dashboard will be able to look for important patterns they can’t now. Just one example is the relationship between the races and genders of victims and assailants.
I don’t live in one of those counties. Can I use the Data Dashboard?
Yes. Well… sort of. There are two important pieces of the data dashboard. The code that runs the application and the data that gets fed into it. The code is now free and open-sourced for you to use as you wish. It’s on github here. The data is a whole different can of beans.
What do I need to do to run the application?
This is not a push-button, set-it-and-forget-it system. You’ll likely struggle unless you have a decent amount of experience with some flavor of Linux, Python and JavaScript. Once it is set up, it should function on its own for the most part. Depending on the data you add, however, you’ll likely need to commit to about a dozen hours a month in monitoring and maintenance.
You’ll also need access to web-facing servers. The original Data Dashboard ran on three servers running Debian linux (one for scraping, one for the user-facing portion and search scripts, and a third for the search database). Theoretically, it could run on a single server, though searches and other functionality likely would be slow. In addition, you’ll need a decent amount of disk space, especially if you store items such as report PDFs.
We used Google Compute Cloud as our server platform, though AWS would work fine as well. Other offerings may be suitable, but you’ll likely have difficulty unless you have ssh access to your servers and the ability to install features such as Python modules.
Vaughn Hagerty, a freelance developer and former journalist, did all the development work on the app, and he may be available to help you set it up in your newsroom (or for any other data or web-development work, for that matter).
Where do I get data that I can use?
If you’re in North Carolina we have some statewide data — voter registration and health inspections. But getting the other data is up to you. If the data is online in some format you may be able to scrape it, which will cost anywhere between $200 and $2,000 depending on its format. It’s probably good to budget $350-$500 for a basic custom web scraper. You also probably should set aside about $1,000 a year for maintenance of each scraper. Server costs are negligible — less than $600/year on Amazon, for example. This robot reporter works relatively cheaply.
If you wanted to launch a dashboard with only the types of data it currently ingests — crime, property, health inspections and voter registration — then you should probably budget between $2,500 and $5,000 to launch it in a new location.
If you want to add a new type of data — nursing home inspections or school test scores for example — you may want to add another $1,000 or so for each type of data.
Requesting the data from government agencies is often a bit of an art and a science. Sarah Cohen’s IRE tipsheet on the subject is a good starting point, as is a book called The Art of Access by David Cullier and Charles N. Davis. I’m also happy to work with you on it, just drop me a line.
What’s next?
Another feature that editors at several newspapers requested was the ability to easily embed basic charts and graphs into their websites. We have a prototype of this working and are looking for ways to spruce it up a bit.
At UNC, we’re continually looking for ways to sustain local journalism, especially when we can also provide a richer student experience. We have a growing number of students interested and able to help professional reporters with their data-driven reporting, and we’d like to know how they might be able to best help.
Ryan Thornburg (@rtburg) researches and teaches online news writing, editing, producing and reporting as an assistant professor in the School of Journalism and Mass Communication at the University of North Carolina at Chapel Hill. He has helped news organizations on four continents develop digital editorial products and use new media to hold powerful people accountable, shine light in dark places and explain a complex world. Previously, Thornburg was managing editor of USNews.com, managing editor for Congressional Quarterly’s website and national/international editor for washingtonpost.com. He has a master’s degree from George Washington University’s Graduate School of Political Management and a bachelor’s from the University of North Carolina at Chapel Hill.
