The following piece is a guest post, and does not necessarily reflect the views of this publication. Read more about MediaShift guest posts here.
Readers have never enjoyed greater access to content and the media industry has never been more competitive. Yet news outlets rely on the big platforms to deliver traffic, at increasing cost to the quality of their news content and bottom line.
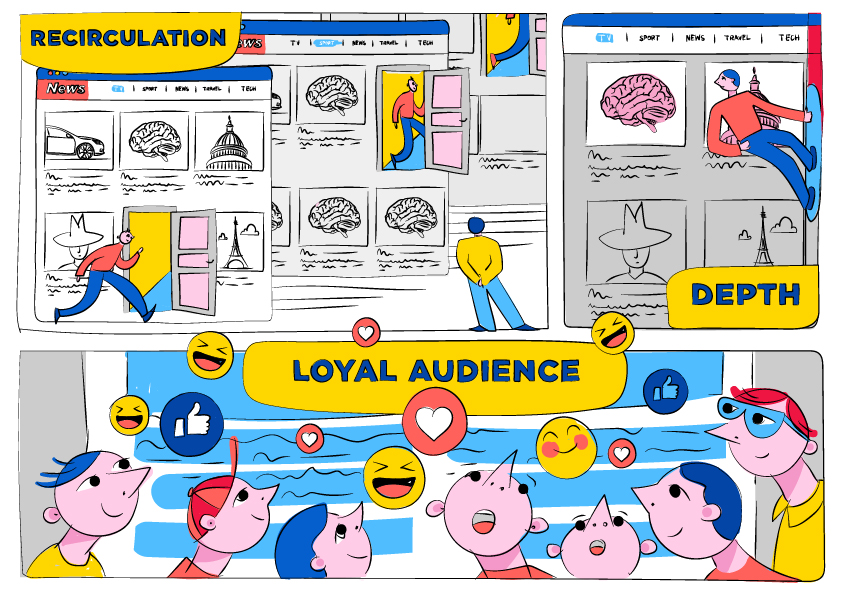
As a publisher, for your project to survive and thrive you need to create a loyal audience — users hungry for content who satisfy their appetite on your site instead of skipping away for their next bite. The best way to measure your success is with a metric called recirculation.
If you’re unfamiliar with recirculation, this article will guide you through what it is, how to use it to maximize potential, and what it can achieve for your team.
What is recirculation?
Recirculation is a straightforward metric. It’s the percentage of users who visit another page of your website after they finish reading their first article. It’s the inverse of Google Analytics’ bounce rate, the percentage of readers who left your website without loading a second page or engaging with anything. And it’s much easier that bounce rate to follow.
With recirculation you can not only examine whether or not an article is performing well on average, but you can also begin to understand which pages your readers are likely to visit next, allowing you to choose — manually or algorithmically — the best links to include on each article page. This can do wonders for your core KPI.
In fact, there are two big reasons to track recirculation.
The first reason is to measure how well you’ve captured the loyalty of your audience. When retention goes up, as measured by recirculation, users are spending longer on your site, engaging more with your content, and hopefully starting a positive feedback loop to further increase loyalty. The second reason to track retention is to understand and increase depth, the number of pages users view on average each session, indicating both how interesting your content is and how well you package it.
How can you increase recirculation?
For starters, learn to link. If you’re publishing content you need to make sure your articles include links to other pages on your site. These links can be contained within the article’s text, or in your ‘read more’ sections. It sounds obvious, but when was the last time you considered how well you use links?
Make sure the links you insert into the text of your article are relevant, and if the subject forms part of a chain of articles on one issue, ensure the links have a logical progression that match the history of the story.
You can also insert tags on related topics of your article. Make sure they’re inserted at the top of your article, and that they remain static when the article scrolls down, to maximize visibility.
After you publish an article, check your analytics tool to see how well your article is performing and which links are performing the best. If recirculation is lower than your site’s average you can do two things to change it.

First, you can add a few cross-links to the article, but only if they lead to relevant articles. Using cross-links can boost recirculation as long as they lead to an article on a similar topic.
Secondly, make sure you have plenty of appealing articles in your ‘read more’ blocks. Your team may refer to them as ‘read also’, ‘related’, or other terms. As opposed to cross-links, include links that are unrelated to the subject of your article. Pique readers’ interests and can lead them down a rabbit hole of varied, interesting content on your site.
One thing you must remember if your articles tend to have several or large ‘read more’ sections is make sure you check your scrolling map.

A scrolling map allows you to see how many people finished reading your article by a specific point. For example, 75 percent might read down to one point, but only 45 percent make it to the next section, so place your most popular ‘read also’ links in the most-read section. This will go a long way towards maximizing your recirculation.
You’ve got the data but how do you measure?
A “typical” recirculation won’t be the same for everyone. If your audience comes from direct sources, rather than through social media, your recirculation rate will be higher.

Bear this in mind when choosing your links. If, for example, the majority of your readers come via Facebook, check which pages (if any) they visited next and include those links in your ‘read more’ blocks. For example, ask whether timely headlines or closely related stories are more effective. Do stories that performed well originally on Facebook also work when targeted to Facebook users on your site?
If two articles share the same number of page views, and you can’t decide which one to place first, check recirculation. The article with the higher rate will allow more of your readers to see more of your content, so pick that one.

Examples: Improvise and adapt to increase recirculation
The worst thing you can do for recirculation is not include any links at all. After all, you do want your readers to read more of your content, don’t you?
If fact, you only need a small increase in recirculation to get a large boost in page views, as two recent efforts by publishers, one in the Czech Republic and the other in South Africa, show.

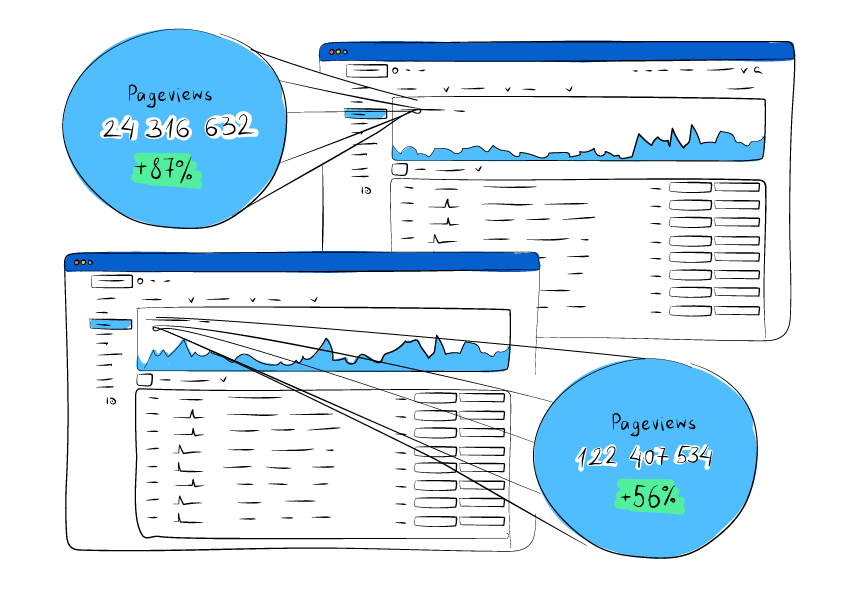
We looked at two different websites that both experienced a major jump in page views over a three month period, Aktuálně.cz and The Citizen, news websites published in Czech and English respectively.
Aktualne.cz achieved a 4 percent rise in recirculation over three months and it saw its page views increase by 56 percent. The Citizen did even better. With an increase of 6 percent in recirculation over a three month period, its page views increased by an impressive 87 percent.
If these two websites can increase their pages views so exponentially with just a couple of percentage point rises, you don’t need to imagine what can be achieved with a 5 to 10 percent or higher rise in recirculation.
And that’s that. A good editorial team will use all the analytical tools it has at its disposal and recirculation is absolutely crucial to growing a project and improving the quality of the content you publish.
It’s vital as increased page views and audience size will improve other factors like ROI, in short, every aspect of your project can be improved if your editors harness the power of good recirculation.
Remember to always measure your recirculation rate and constantly consider how you can improve, both as an individual and as a team. After all, the best editorial teams are those driven by data.
Andrew Sweeney works at .io technologies, a digital analytics company that provides tools and services for publishers and e-commerce.
All images courtesy of the author.

So does recirculation rate = Google Analytics’ exit rate? I don’t know what you mean by saying it’s the inverse of the Bounce rate. That would imply you are just looking for the low Bounce Rate stories.