Click the image to read the whole series. (Public domain image from DARPA)
Teaching Gen Y’ers is a challenge. First, you have to capture their attention when students can access myriad interesting conversations and games on their computers and phones while you natter on at the front of the classroom. And often, it seems like you’re in a room full of people who have high expectations about getting good grades but little interest in working on assignments.
So how can you engage these multitasking millennials? Simultaneously provide more structure and freedom.
In the journalism program at Sheridan we had a puzzling issue with our Online News Production class. Attendance was atrocious and in course surveys, students said they felt the material wasn’t useful. But grads surveyed all said they wished they’d learned more about digital journalism. And as faculty, we knew web skills were key to students’ future employment.

Photo by European Parliament on Flickr and used here with Creative Commons license.
So this year, my colleague, Cheryl Vallender, and I decided we’d revamp the class within its existing framework to try and shake things up and make it a course both students and faculty could get excited about. You can check out the course outline here.
Embracing a blended learning approach
The first thing we did was flip the traditional model of sharing information in class and having students work on assignments outside of class. To ensure the assigned homework, readings, and visual tutorial were actually digested every week, we had a short test or assignment due first thing in the morning. Then at the end of class another assignment was due based on whatever component we were teaching them in class, for example an infographic.
The reason for turning the traditional paradigm on its head was twofold. You can sit anywhere and read a PowerPoint but often when working on things of a technical nature, like a map, people need help.
Also, our students are very mark-driven. By making an assignment due at the beginning and end of each class, we thought it would encourage them to show up. It worked like a charm. It was a challenge managing a steady stream of marking every week, but creating detailed rubrics made it manageable. And the level of participation in the classroom outweighed any negative impact.
To keep students happy, we tried to make the assignments fun – like our “Amazing Race”-style scavenger hunt where they tore through the college searching for information, while having to live blog about their process and discoveries.
And to make each assignment valuable in terms of learning a new skill, we ensured they worked on technologies relevant to their final data-driven group project (completed in the last seven weeks of the course).
Finally, we let the students decide the subject of their data project and determine the best ways to share the information gathered. They each had to present an idea to the class, with suggestions on how data could be displayed, and the class then voted on which topic they were most interested in exploring. Students then selected which role on the project would best suit their skill set, for example reporter, writer, designer or community editor.

Photo by European Parliament on Flickr and used here with Creative Commons license.
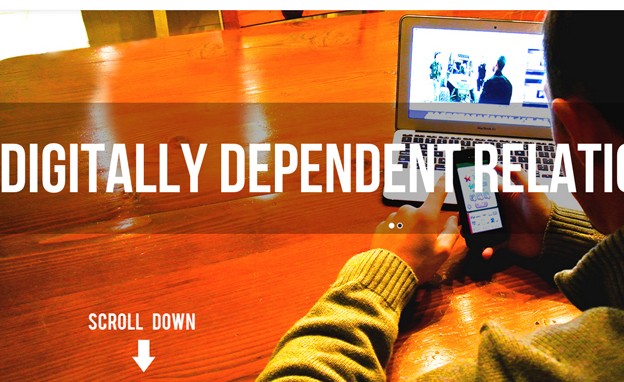
By handing over the reins in terms of content selection and format, while still maintaining quality control, there was no longer a fight to be heard. We acted more as consultants than teachers. The result – Digitally Dependent Relationships: Gen Y Online – is one of the best student projects Cheryl and I have had the pleasure of supervising. And it just received a huge nod of recognition.
Playing with the big kids
The site is shortlisted for the 2014 International Data Journalism Awards – up against projects created by the likes of the the New York Times, Mother Jones and ProPublica. Ours was developed by students enrolled in their third semester of a two-year diploma program. Wow.
Even though the class was successful, in retrospect there are a few things we’d change. Although we shifted the majority of our digital chalk and talk out of the classroom, next time around we’ll pretty much eliminate all of it and get right down to demonstrating the technology and starting the hands-on assignments.
Our biggest issue, though, was that after students created this great site, it basically just sat there because we hadn’t incorporated any kind of follow-up into the next semester’s curriculum. In the future, we plan on having the project filter over into another class.
I also don’t want to give the impression that it was all unicorns and flowers in the classroom. We still faced common issues surrounding the completion of work in a group project, and in one course survey, a student suggested we teach them something more useful like creating their own WordPress site – their first assignment.
But generally, student response was overwhelmingly positive, and we’re already looking forward to bringing this course to the next batch of budding journalists we’ll stand in front of next fall – and maybe beating the New York Times for a Data Journalism Award! Why not? It’s our job to teach kids to dream.
The Sheridan project did not win in its category at the Data Journalism Awards; however, it was one of only five selected to run for the People’s Choice Award, which was taken by the New York Times. For everyone involved, the nominatons themselves were seen as a great success.
Our latest class project, #whatarethechances, examines how race, gender, income, and mental health can impact a Gen Y’s opportunity to succeed. It is currently a finalist in the Canadian Emerging Media Awards and we are waiting to hear if it makes the cut as a finalist for this year’s Data Journalism Awards. Fingers crossed.
Nicole Blanchett Neheli is the program coordinator of the journalism broadcast program at Sheridan College. Her current area of research and study is participatory journalism and is showcased on her blog, Redefining Journalism, where this post originally appeared. She is also a section editor and regular contributor for The Canadian Journalism Project: J-Source, and has acted as a jury member for the Gemini and Atlantic Journalism Awards. Before joining the academic world, she worked for 10 years at Citytv in Toronto as a news writer and show producer.
