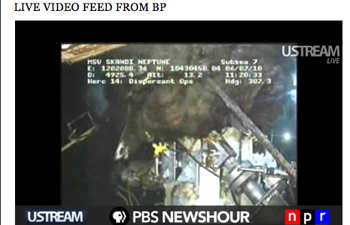
The [oil spill in the Gulf of Mexico](http://www.pbs.org/newshour/rundown/horizon-oil-spill.html) has lasted more than two months now. It is the worst spill in U.S. history, and it is likely to continue until at least August. And in covering it, PBS NewsHour has broken every traffic record it ever had thanks to great reporting, our live video feed of the spill and the ticker showing the number of gallons released.
So what have we learned? Below are some of the insights we’ve gathered so far. (Quick note: A lot of the thinking behind this post comes from a debriefing at work with my colleagues Vanessa Dennis, Travis Daub and Katie Kleinman, and from conversations about the spill and our coverage with other people in and out of the newsroom. Just so no one thinks this is all coming out of my head. Now then…)
1. Embrace the Uncertainty
New York University professor Jay Rosen [recently wrote](http://journalism.nyu.edu/pubzone/weblogs/pressthink/2010/06/22/reply_ambinder.html):
> It’s incumbent upon journalists to level with people. If that means backing up to say, “Actually, it’s hard to tell what happened here,” or, “I’ll share with you what I know, but I don’t know who’s right.” This may be unsatisfying to some, but it may also be the best an honest reporter can do.
> Portraying conflicting accounts or clashing interpretations is an exacting skill, which does require a certain detachment. But there is no necessary connection between that skill, or that kind of detachment, and the ritualized avoidance of all conclusions, such as we find in He Said, She Said and the View from Nowhere.
Rosen is talking about political journalism, but I think it applies very well here (and there are plenty of political facets to this story). As I said [in my earlier post on the spill](http://chrisamico.com/blog/2010/may/24/oil-gulf/) on my personal blog, part of what made me hesitant to make that now-famous [ticker that tracks the spill](http://www.pbs.org/newshour/rundown/2010/05/newshour-oil-widget-2-including-spillcam.html) was having to choose a flow rate when there were so many conflicting reports.
Uncertainty is part of the story here. Sometimes it’s a [huge](http://www.pbs.org/newshour/rundown/2010/05/how-much-oil-has-spilled-in-the-gulf-of-mexico.html) part. There are probably a lot of journalists uncomfortable saying so explicitly, “We don’t know, and neither does anyone else,” but it’s what the story is here.
2. Commit to the Story
For big, complicated events where lots of people are watching — where knowing what happened is easy but knowing what it means is hard — the NewsHour has learned how to tell the ongoing story and, critically, to stick to it.
We don’t do this for most stories. There are lots of one-off blog posts and features, and plenty that can be told with one segment on the show. The stories where we can dive in and hang on, though, is where the good stuff happens.
Also, putting it all [in one place](http://www.pbs.org/newshour/rundown/horizon-oil-spill.html) is helpful.
3. Give Users Tools to Answer their Own Questions
Here’s what I [told Poynter’s Al Tompkins](http://www.poynter.org/column.asp?id=2&aid=184196) about creating tools for users:
> The NewsHour is a public media company, and I think part of our mission is to give the public tools to understand the news better. People see this and have different reactions, and by letting them embed it on their own sites, we allow the conversation to spread beyond areas we can think up ourselves.
There are questions we’ll never think of. That’s true of the NewsHour, and it’s true of the New York Times. And even if we could think of every possible angle to a story, there is no guarantee that we’ll answer your particular question. Building tools our users (and reporters) can use gives us a way to catch more of those questions and find more of those answers.
4. Build Things That Make your Reporting Better
Here’s what I’m most proud of about the widget/ticker that I didn’t want to build: It made our reporting better.
If we were going to estimate how much oil had flowed into the Gulf, it was vital that we knew what the estimates were, how they were made and what numbers were defensible. I’ve rewritten the JavaScript a handful of times as the situation has changed, and [tracked those changes](https://spreadsheets0.google.com/ccc?key=tc5EJx804EUxcwwmkTM322w&hl=en#gid=0). My colleague Lea Winerman has gone back to scientists repeatedly to get their read on the latest data. We can stand by our math.
Most of this is just good beat reporting — but having a constant, visual reminder that we need to be right is a nice prod.
5. Do Something New
Probably obvious, but it bears repeating.
6. Be Clear
I’ve written a lot of blog posts about math lately. I try to make these as readable as possible — but it’s still math. And I think it’s important to explain where we’re coming from and how we reach the numbers and conclusions we reach.
This comes back to embracing uncertainty. Here’s what we said a week ago, as we [struggled](http://www.pbs.org/newshour/rundown/2010/06/uncertainty-abounds-as-the-gulf-leak-meter-ticks-higher.html) to find out whether more oil was coming out of the ruptured well after BP cut the riser pipe:
> Did the flow rate increase significantly after June 3, when BP cut the riser pipe in order to put the current containment dome in place? And if the flow rate did increase, by how much?
>
> We haven’t found a clear answer to that question. An Interior Department official said that preliminary analysis suggested a modest increase, but that they didn’t have definitive information to measure the change.
>
> And Ira Leifer, a researcher at the University of California-Santa Barbara and a member of the flow estimate panel, told us in an e-mail that the scientists can’t be sure of whether there was an increase because BP didn’t provide enough data from before the riser cut to get a good estimate of the flow then.
>
> Given that uncertainty, we initially left the minimum flow rate in our Gulf Leak Meter at 20,000 barrels per day, reflecting what the government’s Flow Rate Technical Team reported on June 10 — an estimate they based on data from before the riser was cut.
>
> But today, BP says it captured 16,020 barrels of oil and flared another 9,270, for a total of 25,290 barrels (1,062,180 gallons) diverted from the Gulf.
(I say “we” in this case because parts of that post were written by me, and parts by Lea Winerman.)
This is getting awfully long, so in keeping with the above principles, I’m going to open it up from here. What other lessons should we learn from covering the spill? What lessons have you learned? Share them in the comments below.
Chris Amico is a journalist and web developer based in Washington, DC. As the interactives editor for the PBS NewsHour, he tells stories with data and documents. He built the database application behind the award-winning Patchwork Nation, along with other tools used by NewsHour reporters and producers. He blogs about news, code, China and travel at chrisamico.com.

What I’ve learned as a resident of the Gulf coast is that 70+ days into this disaster, I have almost no more useful information than I did 2 months ago. One of the most obscure areas is the claims process. BP has a team of lawyers to help them determine “legitimate” claims, but most of us living here don’t know enough about property law to know what our valid claims are, what we have to show to prove it, nor what dollar figure is appropriate given any particular claim. I started a forum this weekend in the hopes of getting some discussion about it. Anything helpful anyone has to say can be posted at http://www.excuse2sue.com
Great post subject. As a viewer I think one thing I would like to see more of from all media sources is graphic maps. I feel this is a geographic story as much as anything else and it can be hard to contextualize it all “on the ground.” Even the issues like where the media has been turned away, where the most wounded wildlife has been found, where the most severe economic damage is forecast to occur, or where the dispersant has been released– that don’t immediately seem like geographic information as much as “human interest” or such, might be better revealed if done so in part graphically.
Brian, you may already be aware of this, but you if you haven’t seen it, Louisiana Bucket Brigade has an interesting, citizen-created crisis map. It includes all sorts of things, from where injured wildlife have been found to where protests are being held.
Disclaimer: I have no affiliation with the organization, nor do I attest to the veracity of its content. I just thought it was cool.
http://oilspill.labucketbrigade.org/
http://oilspill.labucketbrigade.org/reports/
This thoughtful, philosophical list of lessons learned is part of why PBS is such a high-quality news organization. Thank you for contributing to both your audience and the overall culture of journalism.
I believe this incident is so profound, that we are all approaching some form of “overloading” of our ability to process the enormity of the event, which complicates the problem of how to objectively report on, or share information about it. Perhaps in the long run, this event will finally bring us to the recognition of the limits to our human abilities to contend with the incontendable, which is the potential destruction of the life-support systems of the planet itself…if the protracted demand for oil is the core problem….which it appears to be. This oncoming conflict with what our desires want, and what is realistically possible can only be resolved by our world-wide acceptance of the fact that we all may be facing a horror that goes beyond what is psychologically acceptable, and what goes beyond the pale. One can sense this in reading the many blogs across the internet at this moment, from concerns about this emergency that has blindsided us all, and rendered us numb and frightened. Our government leaders are, after all, only human, and may be as privately frightened as all of us have become. Yes, the oil companies have all probably done stupid things in their attempt to save money, cut costs, in their search for greater discoveries of Petroleum to fuel the modern world we all demanded of them…but we’ve allowed this to happen, not because we were all stupid, but because everyone thought nothing of this magnitude would ever befall us as a world society….and now we have This…It might be better to redirect our mental energies into what to do next, rather than blame all the guilty parties, for this will not help us in the immediate here and now of it all. It should be obvious that all further drilling at great depths of the Oceans should cease! A reduction of the speed of our vehicles should also be reduced to conserve fuel. The political demands upon the court systems to oppose these simple beginnings will only complicate matters for the worse. It would be good to hear further suggestions from everyone on what the shape of a post-petroleum world could look like…as quickly as possible. Leave your vengeance against BP behind, they will be dealt with. How to move quickly to a bio-fuel transportation system, and Solar and Wind powered domestic dwellings would be a rational place to begin…let us then begin…