The MediaShift Innovation Spotlight looks in-depth at one great mash-up, database, mapping project or multimedia story that combines technology and journalism in useful ways. These projects can be at major newspaper or broadcast sites, or independent news sites or blogs.
I usually run two spotlights per month, but this month I have so many great projects, I decided to do a mini-spotlight to get the word out about more projects.
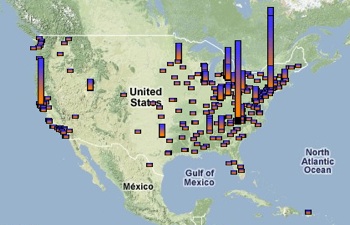
ProPublica’s Show Me the TARP Money is a simple map and chart reflecting the recipients of money provided through TARP (Troubled Asset Relief Program), a federal program that authorizes the U.S. government to buy assets from struggling financial institutions in an effort to remedy the subprime mortgage crisis. The site shows institutions that have been approved for assistance and keeps a running total of the number of institutions, the amount committed, and the amount invested so far. There is an RSS feed and a widget for the site as well.
When the non-profit site ProPublica put this site together, no one else, including the government, was publicly tracking this information.
ProPublica reporter Paul Kiel created a spreadsheet for his own use, tracking the data through press releases and SEC filings. It was easy for the developer to transform the spreadsheet into an ongoing public resource.
How It Came Together
The TARP bill was passed in October, but the Treasury Department did not start releasing any details on approval until about a month later. For a while, the only way for Kiel to find out what was happening was to track down the information himself.
ProPublica producer Dan Nguyen turned the spreadsheet into an XML list which could easily be used to create maps and charts of the data with some PHP and Javascript. He said they hope to build up the site with more features soon, including overlaying more economic data.
What really strikes me about this project is how naturally it evolved. How many reporters tracking information on their own could improve their websites by sharing that information online? This is a simple and effective way to do that.
Meanwhile, ProPublica’s director of online developement Scott Klein has written one to two blog posts per week using the TARP data he’s collected, and other news organizations have used his numbers as well. While others have put together lists of approved financial institutions, all the ones that I’ve seen have been static, while Show Me the TARP Money is a constantly updated list.
Big Response
The response to ProPublica’s efforts has been enormous, from banks sending press releases, investors interested in tracking the health of banking businesses, ordinary people wondering about their local banks, and other organizations asking to use their data.
Klein said ProPublica is happy to share the data. All ProPublica content is published under a Creative Commons license, which allows free sharing of their work.
Show Me the TARP Money is currently one of the most popular pages on the ProPublica site, according to both traffic and media mentions. It’s a great example of how reporters and web developers can work together to create useful features for an interested public.
Please let me know of any innovative projects you are working on or have seen lately. It doesn’t have to be from a major newspaper, it just has to be an innovative blend of journalism and technology. Please e-mail me at mtaylor[at]megantaylor[dot]org to submit a Spotlight recommendation.

