From time to time, I’ll give an overview of one broad MediaShift topic, annotated with online resources and plenty of tips. The idea is to help you understand the topic, learn the jargon, and take action. I’ve already covered presidential campaign videos online, citizen journalism, online privacy and various other topics. This week I’ll look at political polling sites.
Numbers Junkies
We are an impatient nation. We can’t stand waiting until election day to find out who will win an election — we want to know who will win now. That explains the popularity of political polling simulations, aggregators and analysis blogs in the run-up to the U.S. presidential election. Because we have such a fascination with winners and losers, we want to see the current state of the race on a daily, even hourly, basis, and the web can deliver that in spades.
The popularity of political blogs has helped push more traffic to polling sites and prognosticators. Here’s how the traffic flow works: A pollster like Zogby releases a national poll about the presidential race. Liberal, conservative and non-partisan blogs link to the poll’s results, and poll aggregators include that data in electoral maps and charts. People now have access to more raw poll results as the polling firms themselves have their own blogs and regularly updated sites.
That ring of interest and links has led newbie simulation site FiveThirtyEight.com to rack up more than 350,000 visitors in September 2008 according to Compete.com, up nearly 200% from August. A more established aggregator, RealClearPolitics, owned by Time Warner, had more than 2 million unique visitors in September (up 98.8%), and pollster Gallup.com had 1.2 million visitors (up 82.2%). No telling how big the bump will be this month.
These sites enable our need to know how elections are trending right now. FiveThirtyEight has its electoral-vote simulation projection map each weekday; Pollster.com has a clickable electoral map and various line graphs with rollover features; and RealClearPolitics includes a daily snapshot of polls along with political news and blog headlines.
What most people fail to understand is that polls are only a snapshot in time, and that voters can change their mind at any time between the polling date and the date of the election. However, polls do tend to be more accurate when they’re taken right before an election. For instance, even though the major polling firms had widely divergent takes on who would win the presidential race in 2004 during the campaigns, they actually all were within the margin of error in their final polls.
So with that in mind, here are some of the best political polling sites for numbers junkies to follow, graded on usefulness, tech-savvy and readability.
Overview: Baseball numbers geek Nate Silver took his statistical analysis from baseball and transferred it into the world of politics with this blog named after the total electoral votes, 538. He does more than parse the latest polls; he runs 10,000 simulations per day and uses a complex, evolving six-step process to give a daily snapshot and projected winner. As of Oct. 15, 2008, he had Obama winning in 95.1% of the simulations, with 353.9 electoral votes. Though Silver is an Obama supporter, his numbers have swung with the momentum of the race, and the simulations favored McCain after the GOP convention. He bested the polls in predicting primary races in Indiana and North Carolina, according to Newsweek. What makes this site a winner is the simple design, the lively blog posts and the uber-geek stats and simulations that don’t overwhelm the novice number freak.
Political Bias: Silver and blogger Sean Quinn are both Obama supporters. Silver explains in the site FAQ that “my state has non-partisan registration, so I am not registered as anything.”
Geek Out: Not only are there multiple maps, including Super Tracker and Tipping Point States, but there is a massive spreadsheet of all the polls — with everything on the home page. Plus, they are transparent about pollster weightings.
Tantalizing Tidbit: Silver believes Democrats “have approximately a 3 in 10 chance of winding up with a 60-seat working majority in the Senate.”
Grade: A
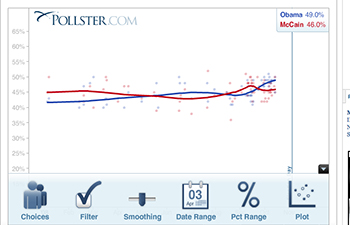
Overview:This site has the advantage of being part of a research firm that is focused on just one thing: political polls. Pollster.com includes fantastic national and state charts that plot every single poll from every firm imaginable. The interactivity allows you to click on a state in the presidential race, for example, and see a line chart plotting the average of all the polls (here’s the one for Missouri). You can then roll over any dots on the chart to see which poll it refers to and what the result was. Plus, the site includes a group blog by top pollsters such as Mark Blumenthal, who came to prominence with his Mystery Pollster blog in 2004.
Political Bias: None detected. Bloggers include academics and consultants for the GOP and Democrats.
Geek Out: Each chart lets you customize it to your own criteria, including adding in the undecideds, picking among polls, changing date ranges and showing trend lines. Plus, you can embed the charts on your own site, as I’ve done here.
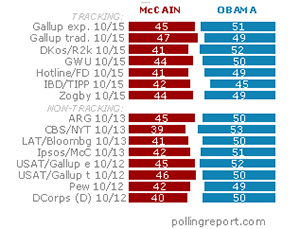
Tantalizing Tidbit: Pollster.com blogger David Moore: “If history is a guide, all [tracking polls] will come within their polls’ margins of errors compared to the final election results. And we will all forget how confusing their different prognostications were during the campaign.
Grade: A
Overview: Folksy site run by “the Blogging Caesar” Scott Elliott, who uses a formula based on national and state polls to predict an electoral outcome in the presidential election. Elliott, who is an unabashed conservative, has Obama winning with 369 electoral votes in a blowout, with the Democrats gaining eight seats in the Senate. While his site’s design is a bit, uh, old-fashioned, he uses interesting formulas based on approval ratings for governor races and on pundit predictions for House races. Elliott says his formulas were very close in the electoral count in 2004, and they also predicted a high probability of the Democrats winning the House and Senate in ’06, which they did. Elliott has an engaging personality and, whether you are conservative or liberal, it’s hard not to feel his pain as his own projections lean toward Obama.
Political Bias: According to Elliott: “Yes, I am Republican, but this formula does not, in any way, falsely inflate the GOP’s standing.”
Geek Out: Not much in the way of interactivity, but there’s a very comprehensive list of projected U.S. House winners.
Tantalizing Tidbit: Elliott has signed up 1,000 paid subscribers to get inside data from the site, all of whom can name their price for a subscription.
Grade: B+
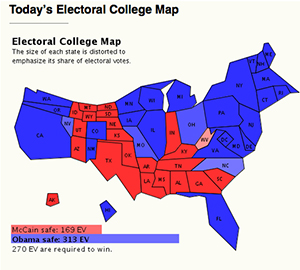
Overview: Neuroscience professor Sam Wang created a patented Meta-Analysis of state polls in the summer of 2004 to try to predict who would win the presidential race. Wang runs through all 2.3 quadrillion possible combinations of electoral votes to come up with a daily snapshot of possible outcomes. While he made an error in 2004, predicting Kerry would win because of an “incumbent rule” that voters swing against incumbents, Wang says he will not repeat this error in 2008. While his blogging voice is typically excitable, Wang scores with a weighted-size electoral map — where states with more electoral votes are bigger — and his theories on which races deserve your contributions and which don’t.
Political Bias: Wang is a supporter of Obama, and first showed up as a Daily Kos diarist, predicting with 95% confidence in July 2004 that Kerry would win.
Geek Out: The Power of Your Vote chart shows which state’s voters hold the most sway (right now New Hampshirites are in the lead).
Tantalizing Tidbit: According to today’s Electoral Map, Wang is 95% confident that McCain will win Indiana and Obama will win Florida.
Grade: B+
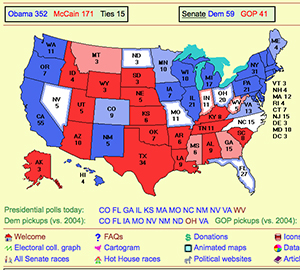
Overview:Another popular favorite from 2004 (like Real Clear Politics and the Mystery Poller), Electoral-Vote has a spare design that looks like it was created circa 1994. Run by “the Votemaster” — computer-science professor Andrew Tanenbaum — the site focuses on an electoral map showing recent polls from the past seven days only. If there has been more than one poll during that time frame, then he averages the results. Tanenbaum is transparent about his methodology and his own political background, and says that he doesn’t let that color his poll aggregation. He also includes “News from the Votemaster” updated daily, a blog-like rundown of the day’s political news. The downside: There’s no easy navigation to see archives as on a blog.
Political Bias: The Votemaster says: “I am a libertarian and lean towards the Democrats, but I have a lot of respect for traditional conservative Republicans like Sen. Barry Goldwater, who believed that what consenting adults do in private is none of the government’s business.”
Geek Out: Cool feature lets you check the polls on this exact date in 2004.
Tantalizing Tidbit: Votemaster says: “We have 10 national polls today (October 15). Obama leads them all, with the average lead of 7.7%. If he wins nationally by even 5-6%, he will probably take all the swing states and it will be a landslide in the electoral college.”
Grade: B+
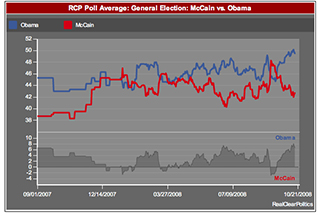
Overview: The ultimate political aggregator, RealClearPolitics was founded in 2000 by options trader John McIntyre and ad exec Tom Bevan, two political junkies who wanted a site that rounded up political news and opinion. The site has been highly popular for doing just that, with headlines from newspaper sites to blogs. For polling, the site aggregates data from polls that it chooses, creating an “RCP National Average” of polls for the presidency (currently at +7.3% for Obama). You can drill down to key Senate and House races, and also see how accurate the site’s predictions were for 2004 and 2006 races. One thing missing for a site called “Real Clear Politics” is real clear explanations on how they pick their polls and why they exclude others. This has caused people to question their objectivity.
Political Bias: FiveThirtyEight’s Nate Silver said he thought RCP was “cherry-picking polls” to make the outlook better for McCain. Site co-founder McIntyre told Human Events magazine in 2003 that, “We have a frustration that all conservatives have, which is the bias in the media against conservatives, religious conservatives, Christian conservatives.”
Geek Out: Nice create your own map feature for the presidential race, with filters to show the last 10 elections.
Tantalizing Tidbit: With no toss-up states, RCP predicts Obama will win by 190 electoral votes.
Grade: B
Overview:Strong, comprehensive site of poll results for national campaigns, Congress and a laundry list of political issues, from energy to stem cell research. The main Polling Report newsletter — and state polls for president — are available only to paid subscribers, who must shell out $79 for four months or $195 per year. But even the free information is enticing, from a recent approval rating of Sarah Palin (with 41% unfavorable vs. 32% favorable) to a family finances poll that shows nearly half of Americans are not confident they will have enough money to support themselves at retirement age. One bummer is the lack of any analysis of polls on the free site; another is the site’s poor navigation.
Political Bias: None detected on the free site, as it is largely a rundown of raw polling data.
Geek Out: When you go to see what recent polls say on a particular issue, such as our nation’s priorities, you get an amazing list of all the polls taken from the past year.
Tantalizing Tidbit: A recent CBS/New York Times poll found that 57% of people said the economy was the most important issue in the presidential race, and terrorism and national security was chosen by only 9%.
Grade: B-
Honorable Mentions
University of Virginia’s Crystal Ball
Taegan Goddard’s Political Wire
What do you think about these sites? Are there any missing ones you think we should add to the list? Share your thoughts and favorites in the comments below.
— Additional reporting by Mike Rosen-Molina

One response to “Your Guide to Political Polling Sites”