In my classroom, I am always missing someone. This isn’t, however, an attendance issue – it’s a matter of not hitting the mark regarding journalistic content. Sometimes, I’m moving too fast, not knowing one student can’t write a headline because she doesn’t understand parts of speech. Other times, I’m moving too slow, not knowing another student already mastered summary news ledes and now is ready to be creative. This is a classic scenario for any educator, but in journalism, we endeavor to be more flexible and more intuitive because our field is pragmatic like no other.
This is where technology shines. No, I am not insinuating that programs and apps will solve it all. Fundamentally, journalism’s ethics and role in society are the same regardless of the latest tool or trick. However, properly implemented online learning can bring students up to speed or push them further in our field, which provides differentiation.
Sensing this, I created a self-led, online instruction module for students in an area of need for our newsroom.
Staffers worked at their own pace. We addressed skill deficits or creative opportunities along the way. And, after trials with learners at various competency levels, we found that it was largely successful and easily replicated.
The entire concept was based on an area called Instructional Design. More specifically, I used the ID model of Walter Dick, Lou Carey, and James O. Carey, to create an experience tailored for the individual learner. This specific project was on infographics. Before the online unit, most of our publication’s infographics consisted of poorly labeled bar graphs.
Part of any journalism program and used frequently in professional publications, infographics are a useful way to display data, particularly as the field moves toward new platform paradigms. However, for my students, the execution was weak. Their prior knowledge on this topic was from satirical or sports/entertainment-based infographics on Twitter, The Onion or ESPN. Part of the goal, then, was to show student journalists the news side of infographics, helping them see that statistically significant data should be presented contextually, cleanly and objectively.

Before our focus on infographics with an online unit, students were primarily creating Excel bar graphs that didn’t provide context or clear meaning.
Online Learning with Infographics
Students worked through seven self-led modules to accomplish this learning goal: Journalism students will create effective infographics (every rubric category at least “meets” or above) that use sound data and design practices to creatively display newsworthy information for publication.
The trick to this instructional design was not only the application of four previous concepts, but also the layering of those skills with new ones to create a product that satisfied not only the creator and instructor – but also the reader, as evidenced by workshopping, formative feedback and revision.
The first pre-assessment was aimed at assessing entry-level skills – including newsworthiness, headline writing, design knowledge and data analysis. A blank slate-type pretest was then given to allow the instructor to gauge the level and type of growth. Lastly, an anticipation guide not only pre-assessed knowledge, but also predispositions and attitudes toward infographics.
With all of these pre-instructional activities completed, the students headed into direct instruction and formative feedback. Students used each module, with its narrated Keynote and peer activities, to both learn and practice. (Note: Based on pre-assessments, instructors can recommend students focus on certain modules or alter the schedule.)
Once all modules were satisfactorily completed, the students constructed infographics for an authentic publication situation, along with a reflection, for a post-assessment.
Feedback from Tryout Learners

After the tryout learners had completed each stage of the online, self-led unit, they showed improvement in each major area that was measured. They also started creating better infographics for our publications.
I invited tryout learners to complete the online unit, and I got a sense of what worked – and what didn’t. Here are a few of the qualitative remarks:
- “The way the assignment was structured allowed me to see the actual thought process of creating an infographic.”
- “I long to always improve myself as a thinker and journalist, so when I began this assignment, I was very excited to tune into those goals. The way these assignments were set up allowed me to be creative but it also gave me the knowledge to know how. I initially had an idea for my post-project that I was unable to do, but this wasn’t because of the lack of instruction. My idea was a little more complex than I had imagined. However, the unit gave me several other ideas I could use.”
- “The lessons were so helpful in that it helped me improve some of my weakest aspects of creating infographics. I really wish the lessons would have gone farther, though, so I could learn more. I really hoped to learn some advanced techniques like incorporating sound or multimedia.”
Application for Journalism Educators

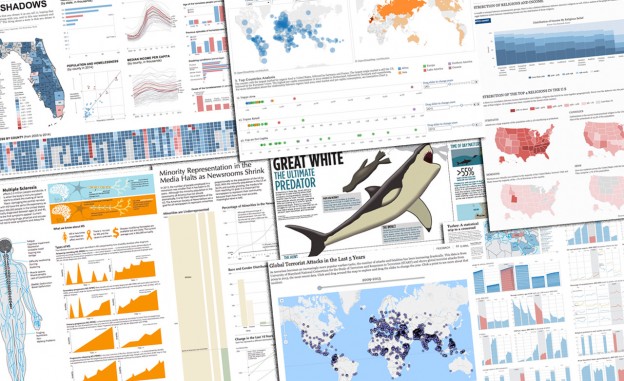
In the end, these students had a better understanding of what they were communicating and why it was important to a specific audience. What students created after this unit, as seen here through the work of my former student Sarah Foster (now a journalism major at the University of Illinois Urbana-Champaign), was head and shoulders above past attempts, particularly in meaning and purpose.
New methods of instruction, assessment and delivery are here. In journalism – where the platform is in flux – students need to master not just the ability to do something new, but the knowledge to accomplish it with ethics, depth and independence. This infographics unit allowed for enrichment or remediation. The structure of a self-led, online unit can be imitated for any aspect of journalism – from feature writing to photography – by assessing and remediating entry-skills, creating a philosophical groundwork, pacing students through modules and formative assessments, and assessing in an actual publication.
Being able to meet student journalists where they are, and stretch them to the next level, is the point of meaningful journalism and purposeful education, regardless of topic.
Amanda Bright is a former professional journalist who later spent a decade as a scholastic journalism adviser of both newspaper and yearbook at Mattoon High School in Illinois. Currently, Bright is a journalism instructor at Eastern Illinois University and the Media Content Coordinator for Indiana State University Online. She also serves as the Social Media Director and Web Co-Administrator for the Illinois Journalism Education Association.
