For the data enthusiasts of the world, the Olympic Games in Rio unleash a trove of new data to play with. And for many budding data journalists looking for data to explore, the Olympics offer a great opportunity to tell data stories.
Medal counts often dominate the headlines during the Games, but the data holds many more stories beyond the podium. Here are several ideas to whet your appetite.
1. Host-City Report Card
Stories about the Olympics can extend beyond the stadium. We often hear about the host city running out of time, money, space, or all of the above. All of those threads contain potential data stories.
Cost overruns, for instance, have become commonplace for host cities. This year, Rio went 51 percent over budget. That might seem like a large number — until you zoom out.
Explore this year’s cost overruns against past Games, and you start to see that Rio’s total of $4.6 billion isn’t so outlandish by Olympic standards. Back in 1976, Montreal exceeded its budget by 720 percent and spent $6.1 billion. And in 2012, Sochi went 289 perecnt over budget to spend a whopping $21.9 billion.

Click on the image to visit the interactive version. (Credit: Dash Davidson)
2. A Look Back at Past Olympic Games
We’ve come to see the Olympics as a predictable set of sports, but the Games have evolved quite a bit over the years.
The Olympic Games began with just nine events in Greece. Since then, we’ve added several sports (like basketball and badminton) and retired others (like croquet and cricket) to reach our current tally of 28.
This data set is rich with story ideas. You can zoom in and explore the quirky sports of Olympics past, like polo, jeu de paume, and tug of war. You can also zoom out and trace the evolution of the Olympic Games itself as Johanna Knapp did in her visualization:

Click on the image to visit the interactive version. (Credit: Johanna Knapp)
3. Medal Count, Reimagined
At every Olympic Games, the medal count makes big headlines. After all, it is the final score of the competitions.
But what if you went a step beyond simply listing each country’s tally of gold, silver, and bronze?
One approach is to look back at past Games to see which countries have historically dominated. You can also present the data so that readers can explore the data themselves, and dig deeper into the countries and events that interest them most.

Click on the image to visit the interactive version. (Credit: Dash Davidson)
You can also present a different perspective of the medal count. The U.S. led the medal count in 2012 — but not when you factor in population.
Peter Gilks created a visualization with a filter that readers can use to toggle back and forth between the two views (total medal count and total per million people). This shows the readers that yes, the U.S. led the medal count in 2012, but when you factor in population, small countries like Grenada and the Bahamas surge ahead.

Click on the image to visit the interactive version. (Credit: Peter Gilks)
4. Record-Breaking Outliers
At every Olympic Games, a handful of star athletes rise as the crowd favorites. And oftentimes, these athletes redefine their sport’s landscape. You can use data to tell their stories at both the individual level and the sport level.
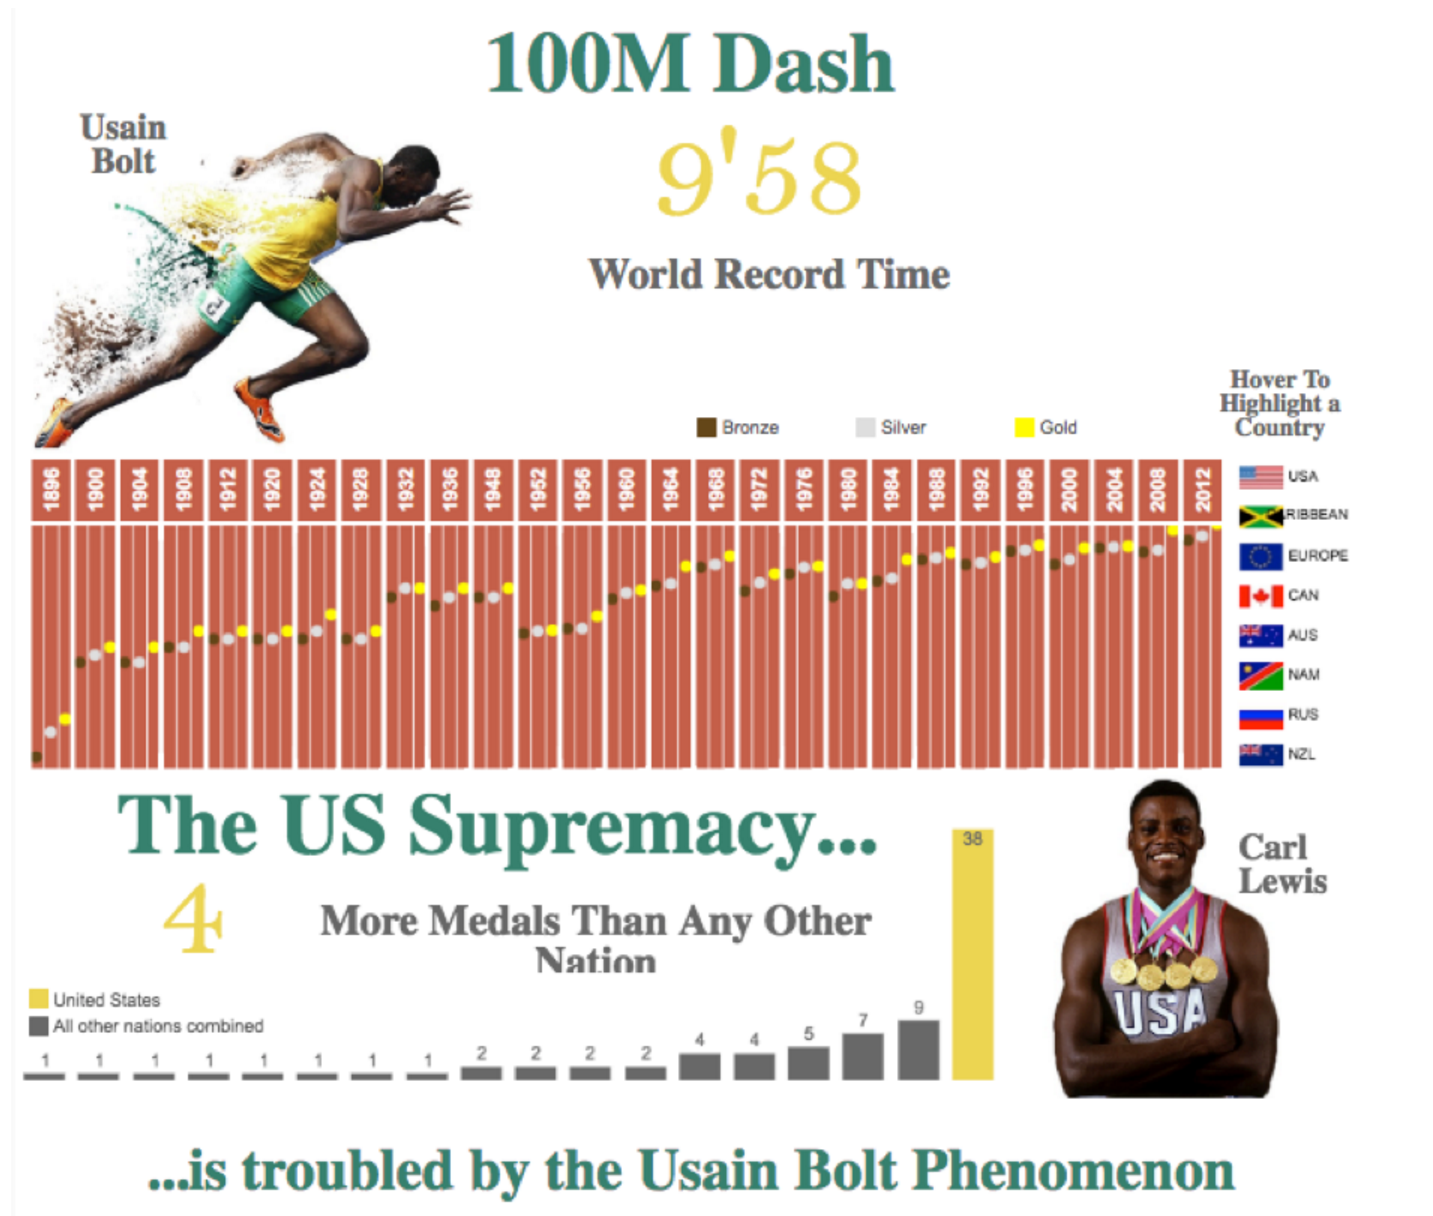
Jamaican sprinter Usain Bolt is one of these exceptional athletes. Bolt is a record-setter in the 100-meter race, which used to be a U.S.-dominated event. (The U.S. has won four times more medals than all other countries combined.)
As the below visualization shows, Bolt claimed the gold in the last two Olympics. (The U.S., on the other hand, took home the bronze both years.)
But the visualization doesn’t just stop there. The dots on the tracks tell a broader story using historical data. They show how the runners’ times have gotten increasingly faster (with intermittent slowdowns in between) since 1896.

Click on the image to visit the interactive version. (Credit: Adrien Charles)
5. Olympics vs. Paralympics
We spend weeks — months, really — talking about the Olympics. And we only spend a fraction of that time talking about the Paralympics, if at all.
Here’s a great visualization that shows the storytelling potential of the Paralympic Games. It shows both Olympic and Paralympic athletes who’ve won the most medals over their careers.
Michael Phelps, who’s broken five world records, ranks 13th on the list. Check out leader Trischa Zorn, who’s competed in seven Paralympic Games.

Click on the image to visit the interactive version. (Credit: Jenny Richards)
The data shows that Paralympians embody a tenacity all their own. Imagine telling the stories of their journeys.
Go Forth and Tell Data Stories!
These are just some of the stories you can tell using Olympics data. You might tell a data story about your hometown Olympians. Or maybe you’ll look at which countries dominate a certain lesser-known event.
Whatever angle you pursue, start by exploring the data. Ask questions and dive deeper. Let the stories reveal themselves and guide your reporting.
