This piece was initially published on Storybench, a cookbook for digital storytelling. Storybench is a collaboration between Northeastern University’s Media Innovation program, a new graduate degree in digital journalism, and Esquire magazine.
“Little did I know that the whole time I was working there, I was killing myself.” That’s what Rick Luzaich, a former construction worker who was exposed to asbestos on the job and now suffers from mesothelioma, an aggressive type of cancer linked to asbestos exposure, told the Center for Public Integrity.
Last week, the investigative news site published the first part of an 18-month investigation into the “epidemic” of occupational hazards, from coughing to cancer, which they’ve titled Unequal Risk.

The Center for Public Integrity conducted an 18-month investigation into the “epidemic” of occupational hazards.
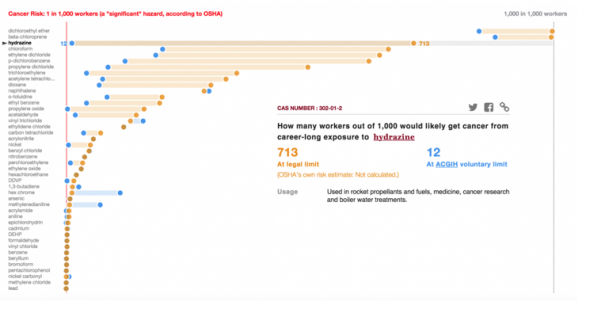
To convey the cancer risk associated with career-long exposure to workplace chemicals, CPI built an interactive graphic for readers to explore the carcinogens and the dangerously and arguably negligently loose exposure limits set by the U.S. government’s Occupational Safety and Health Administration (OSHA) in 1971. The question the graphic sets out to answer is this: “If 1,000 workers are exposed to a chemical’s legal limit over their entire careers, how many will likely get cancer as a result?” Their findings are staggering. They found, for example, that 713 out of 1,000 workers would likely get cancer from career-long exposure to hydrazine, a chemical used in medical research and boiler water treatments, at OSHA’s legal limit.
To peel back the work that went into the interactive, Storybench spoke with CPI data journalists Jamie Smith Hopkins and Yue Qiu. Check out the interactive and then scroll down to read the Q&A.

CPI built an interactive graphic for readers to explore the carcinogens and the dangerously and arguably negligently loose exposure limits set by OSHA .Image from Storybench.
What was the goal of this interactive?
Qiu and Hopkins: We wanted workers to become aware of the problem here. That’s as important as getting the policymakers to understand the problem. From the beginning we wanted to use data to show the problem of occupation health hazards, to see the big picture through numbers. We also wanted to try to get at the issue of risk. What is the actual risk of certain health problems at legal limits? We decided to focus on carcinogens because, for a reader, cancer is a clearer thing to understand than a vague health issue.
Where did you get the data?
Qiu and Hopkins: There’s a former OSHA official, now at the University of Pennsylvania, named Adam Finkel who had put together analysis a couple years ago to help quantify what’s the risk of cancer based on EPA figures and OSHA legal limits. We supplemented that with other data. For example, in 2013, OSHA put out side-by-side comparisons to occupational guidelines and standards (such as CalOSHA, TLVs, etc.).
Tell us about the analysis
Qiu and Hopkins: The first thing we did was find out what these chemicals were, where they were used, which sectors these chemicals are used in. We took the data and checked them against OSHA and Threshold Limit Values standards known as TLVs. TLVs are put out by the American Conference of Governmental Hygienists (ACGIH) and are workplace exposure guidelines that tend to be stricter than OSHA’s. Then we showed our analysis to experts after a lot of foundational legwork. Throughout the whole process, we were calling experts to vet the data, to look at our analysis. We had to make sure that we were comparing the right things. It took a long time to get to the point that we were comparing apples to apples.

CPI’s analysis includes chemicals with OSHA exposure limits and ACGIH recommended limits that can be compared. Image from Center for Public Integrity.
What did you decide to visualize and why?
Qiu and Hopkins: We wanted readers to capture the difference between TLV and OSHA standards. We were always thinking about how this was going to be meaningful to people. How can we convey uncertainty without overwhelming our readers? Users can filter by the sectors they work in and look for chemicals that are used in their occupation. The graphic itself can be used as a navigation bar. Users can mouse over it and see if the chemical is related to their own occupation. We asked, “How do you emphasize the absolute value?” What does one in 1,000 versus 20 in 1,000 workers mean? We ended up placing that information card in the center of the graphic.
I know it’s early but what do you estimate the impact to be of this work?
Qiu and Hopkins: This is one of those fairly rare regulations where the federal agency has said preemptively that these standards are not protective. It’s like one of the widows told us: “As easy as it might be to say that Congress, OSHA and industry should do more, workers need to realize that they have the right and responsibility to be thinking about it.”
Any thoughts on the use of statistical analysis in journalism?
Hopkins: “It made me feel really good that we weren’t coming up with this from scratch. We were using data from experts in the field. How do I know that we’re not missing something obvious? I was finding people with expertise in risk assessment and occupational health saying, “Yes, there’s nothing wild and crazy about this model.” It calmed me down to have these conversations. It was very helpful to hear that from experts.”
Qiu: “As a data visualization designer I feel more and more comfortable putting statistical analysis out to the public. They are more and more educated by the news industry today. Outlets like FiveThirtyEight have educated them so that now we have more space to present them more complicated analysis. Conveying things like p value or log will take more time, of course.”
Will we see more collaboration between journalists and academics?
Hopkins: “It is heartening to see more efforts to work together. These methods can really help journalism.”
Qiu: “Our privilege is to ask for help from people that are smarter than us. We’re good at communicating. They’re really good at their studies. I am optimistic in seeing more cooperation between the two.”
Aleszu Bajak (@aleszubajak) is a journalist covering science, energy, the environment, and health across the Americas. He’s the founder and editor of LatinAmericanScience.org, a resource for science news out of Latin America. In 2013 he was awarded a Knight Science Journalism Fellowship at M.I.T., where he explored the interface between journalists, designers and developers. He now teaches journalism at Northeastern University’s Media Innovation program and edits Storybench.org, an under-the-hood guide to digital storytelling. Before freelance reporting from Latin America, he worked as a producer for the NPR talk show Science Friday. He writes for Nature, Science, New Scientist, and SciDevNet, among other outlets.

This piece was initially published on Storybench, a cookbook for digital storytelling. Storybench is a collaboration between Northeastern University’s Media Innovation program, a new graduate degree in digital journalism, and Esquire magazine. Storybench provides an “under the hood” look at the latest and most inventive examples of digital creativity and the tools and innovation behind them. Follow Storybench on Twitter and Facebook.
