How can I best tell the story?
That’s one of the most important questions I’ve learned to ask while working at Reese News Lab.
![]()
I’m a word person. I like news writing, and I dabble in short stories and poetry. There’s a huge part of me that says, “You know how to write. Why don’t we stick with that?” But as an avid consumer of news, I’ll be the first to admit that other forms of journalism are often more engaging and tell the story better than a block of text.
Rather than say “this is a story for a designer,” I’ve sought out non-traditional ways to tell stories that I, as a writer with no programming or design background, can actually do. This is not to say that I don’t consult a designer before, during and after creating the story, because I do. But there are certainly ways that a traditionalist like myself can add a little pizazz to a story through graphics and multimedia.
Here are some basic, non-traditional lessons that I’ve learned this summer:
1. Use existing code
While working on a story about the learning losses that kids face in the summer months, I compiled a list of STEM summer camps in the state of North Carolina. But I wanted to make the list searchable. If your kid was a 5th grade student interested in engineering, I wanted you to be able to easily find those camps in that list. I didn’t know how to create it myself, but it turned out that we already had the code for a searchable data table. All I had to do was enter the data.
2. Don’t let Illustrator scare you
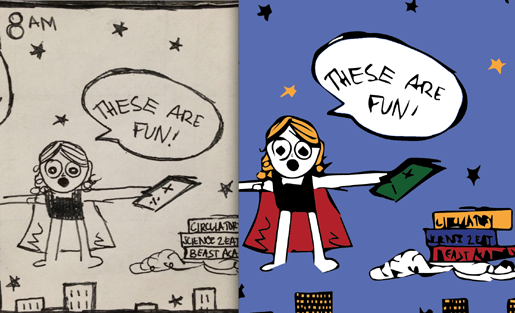
While researching a story about math textbooks done in comic form, I decided that I wouldn’t have a complete package without a comic strip to accompany the text. I didn’t know how to draw a comic with software, so I hand-drew one. After it was done I scanned and inserted it into an Adobe Illustrator document. I had no previous Illustrator experience and had honestly, always been a little intimidated by my many peers who listed it on their resumes. But the program is actually pretty user-friendly, and I was able to produce a comic strip that enhanced the story.
3. You can learn video
I’ve always been impressed by videographers. I think I’ve always been a little sure that it’s a skill you’re just born with. While natural talent certainly doesn’t hurt, it is possible to shoot and edit good video even if you’ve never held a video camera before (as we all did for our Bald Head Island story). Here are some some basic video tips I picked up:
- Use a tripod whenever possible.
- Be aware of the lighting. You can fix lighting by adjusting the camera’s aperture, shutter speed, and ISO.
- Follow the rule of thirds!
- Get a variety of tight, medium and wide shots. Use tight shots to transition while editing.
- Gather audio from your camera and a separate recording device.
- Be patient.
4. There are free infographic tools available
If you’re an experienced Illustrator, you can probably create an infographic all by yourself. But if you’re a novice, there are a number of free websites that can help. For a story on teacher salaries, I had numbers and information that I wanted to organize in a way that was easy to understand. I used a site called piktochart.com to create an infographic.

I created an infographic explaining the Douglas County School District’s new system for paying teachers.
5. Use the Internet
If you can’t figure something out, use a search engine. You’ll likely find a handful of helpful how-to videos and tips. Also, use the Internet if you’re looking for inspiration. Check out non-traditional methods other people have used and then add your own style to make it work for your story.
If you want other non-traditional examples, check out these that STEMwire has created:
- An interactive quiz that lets you determine whether you’re smarter than a fifth grader.
- A map that makes each state’s STEM report card visual.
- An infogr.am graphic showing how STEM-literate the U.S. Congress is.
- Infographics built from scratch to tell the story of a STEM field trip, STEM at Hogwarts, STEM politicians, and superheros with STEM backgrounds.
- A slideshow of STEM entrepreneurs’ inventions.
- A list to tell the stories of eight organizations that work with women in STEM.
- A Storify compilation to tell the story of MindDrive, an organization that teaches students through a social media powered car.
- “Choose-your-own” map of math blogs.
And non-traditional storytelling isn’t just for the news, as my colleagues in the Reese News Lab Summer Start-up have found. It’s also helpful in business.
Samantha Harrington is a journalism and Arabic major at the University of North Carolina at Chapel Hill. She is reporter at Reese News Lab with STEMwire.org and can talk forever about global politics and digital media.
This story originally appeared on Reese News Lab.
![]() Reese News Lab is an experimental news and research project based at the School of Journalism and Mass Communication at the University of North Carolina at Chapel Hill. The lab was established in 2010 with a gift from the estate of journalism school alum Reese Felts. Our mission is to push past the boundaries of media today, refine best practices and embrace the risks of experimentation. We do this through: collaborating with researchers, students, the public and industry partners; producing tested, academically grounded insights for media professionals; and providing engaging content. We pursue projects that enable us to create engaging content and to answer research questions about the digital media environment. All of our projects are programmed, designed, reported, packaged and edited by a staff of undergraduate and graduate students.
Reese News Lab is an experimental news and research project based at the School of Journalism and Mass Communication at the University of North Carolina at Chapel Hill. The lab was established in 2010 with a gift from the estate of journalism school alum Reese Felts. Our mission is to push past the boundaries of media today, refine best practices and embrace the risks of experimentation. We do this through: collaborating with researchers, students, the public and industry partners; producing tested, academically grounded insights for media professionals; and providing engaging content. We pursue projects that enable us to create engaging content and to answer research questions about the digital media environment. All of our projects are programmed, designed, reported, packaged and edited by a staff of undergraduate and graduate students.
