The following opinion piece is a guest post and does not necessarily reflect the opinions of this publication. Read more about MediaShift guest posts here.
Reporters and writers are expected to do more and more with less and less.
Not only do today’s digital journalists interview, cover and write, they’re also expected to photograph, videotape, blog, Tweet, post on Facebook and share their stories across social media properties. They have fewer resources to rely on, the result of media downsizings and newsroom cutbacks that have reduced the number of photographers, videographers, illustrators, graphic designers, producers and editors who previously contributed to the story-telling process.
And many journalists are keenly aware that their professional evaluations are based as much on their digital performance and metrics as on their ability to write, narrate and tell a compelling story.
Digital Mapping: A Storytelling Tool for Journalists

The Huffington Post used this map to help illustrate a story on immigration. Screenshot.
The digital era of journalism offers a growing number of online resources that can fill the void, especially when reporters need an extra visual “oomph” to take readers to the scene with locational elements can help tell a better, more compelling story.
Online mapping tools are one example of resources that enable journalists to create customized and shareable maps quickly to add detail, multi-media content and locational context to their stories and articles.
The benefit is that journalists do not have to learn graphic design skills, understand Photoshop or Illustrator, or know a single piece of programming code.
With these new digital resources and from a simple user interface, journalists can create – in a matter of minutes – a customized, shareable map on any topic or theme, anywhere in the world. Knowing that readers (and viewers) love maps, journalists can log into map-creation tools and craft a map that pinpoints the location of a raging wildfire in California, a manhole cover linked to a prison escape in Dannemora, NY., the newly reopened U.S. Embassy along Havana’s Malecón, the migration routes of Syrian immigrants through Hungary into European Union countries, or a rebuilt neighborhood in New Orleans 10 years after Hurricane Katrina.
My company, MapJam.com, for instance, features a descriptive “content card” for titling each map and supporting other sources of multi-media content – images, videos, SoundCloud audio clips or podcasts – to further set the scene and embellish the story.
Imagine a travel piece about Iceland, for example, that features a video-enhanced online map, complete with sound track and a pin identifying the exact location. Or consider the detail that can be added to analysis of immigration patterns to the U.S., with content, photos and insights provided by immigrant contributors.

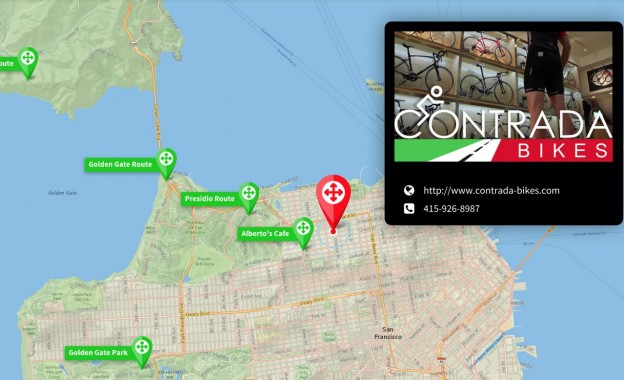
A sample MapJam map.
Maps in Minutes
For journalists who are on deadline or operating without the readily-available talents of a graphic artist, illustrator or programmer, customized online mapping tools provide easy-to-create art in less time that it would take to fill out a request form to the art department. A user-friendly web application can make it easy to incorporate multi-media components of stories, and combine them quickly into a single map.
At their very basic, journalist-created maps can bring to life simple, visual details: the location of a soon-to-open business or school, the scene of the crime, or road closings for an upcoming community parade.
At a next level of sophistication, customized digital maps become a boon to 24/7 digital journalism and online publishing. Some maps reside at live URLs and can be updated in real time as events, conditions, contexts and facts change and evolve. These real-time online maps become interactive, living-breathing elements of any story. As a wildfire spreads to another neighborhood or location, for example, maps can visualize the movement and “follow” the story as it unfolds. At MapJam, for example, journalists can update maps easily simply by logging into the interface and adding/changing content to an existing map; the URL remains the same.
Customized maps can also help tell larger-themed stories, make connections or highlight patterns, trends and way points, such as a neighborhood’s five most vulnerable intersections for pedestrians, for example, or the location of various establishments that participate in any city’s popular “SantaCon” holiday pub crawl.
Readers benefit because of unique visual elements that help put them in a specific place at a specific point in time and give context, identify and a sense of place to a journalist’s words.
And journalists benefit, not only from the ability to tell compelling stories, but also from access to online resources that makes customized maps easily shared with the digital community — the very realm that can document and track traffic, links, clicks and metrics. Some of the online resources host maps at customized and shortened URLs that can be embedded and shared on Facebook, Twitter, Google+, LinkedIn, Pinterest or via WordPress plug-in, text message, multimedia message, email or QR Code.
What’s ahead for digital mapping made easy?
Customized online maps create new ways of delivering, analyzing, measuring and localizing journalism. “Geofence journalism,” for example, can encompass quick-to-create, easy-to-share mobile maps that alert the public or send warnings about nearby traffic accidents, natural disasters, fire/rescue scenes or floods. Easily created maps, and their accompanying push notifications, can deliver Amber Alerts quickly to specific locations and areas. If journalists themselves use online maps to log the addresses of their daily assignments and news stories, editors and managers can plot the points to “map” the day’s news – literally – as a way of evaluating their publication or outlet’s geographic news concentration or areas of highest coverage and activity.
The emergence of digital journalism, marked by evolutionary growing pains, brings with it new digital resources, including customized digital mapping tools, that help journalists pursue the art of storytelling in ways that are visually compelling – and easy to create, share and track.
Jack Gonzalez is Co-CEO of MapJam, a mapping platform that enables users to create customized, easily shared online maps by adding dynamic content, media and branding. A former geography teacher, Gonzalez has worked with direct marketing, publishing, IT and technology firms in Europe, Australia, New Zealand, the U.S., Middle East and Africa.
