Reporters in North Carolina are starting to use a new tool developed at the University of North Carolina at Chapel Hill that will help them speed up their everyday reporting and find stories that are hidden in the mass of public data held by local governments in the state.
Open N.C. has collected information from nearly 9 million public records across the state and organized them into a single database that reporters can search from a simple Web interface. It’s a growing dataset, much of it updated daily. It also uses the records to look for patterns that might tip off reporters to potential story ideas.
At the time I write this, records reporters can search from one spot include:
- Incident Reports: 700,000
- Arrest Reports: 700,000
- Property Tax Records: 600,000
- Real Estate Transactions: 200,000
- Accident Reports: 180,000
- Citations: 150,000
- Restaurant Inspections: 50,000
Reporters in New Hanover and Wake counties testing the first beta versions of the dashboard have already used it to find stories they plan to produce in the next few weeks. We also have a complete dashboard up and running for Buncombe County. Ultimately, we’d like to have dashboards for each of North Carolina’s 100 counties. We’re prioritizing those buildouts based largely on data availability and journalist interest. You can expedite that process by pointing us to data sources that you’d like to include, such as crime reports.
What Reporters Can Do: Background Searches

Photo provided by Ryan Thornburg
One of the most time consuming tasks of daily journalism is finding contact information for potential sources and facts about people and places. We’ve sped up that process. Reporters often start their search for a source with Google. They might then shuffle through two or three state or county websites looking for voter registration or property tax information. Each of those sites have different search interfaces, most of which are difficult to use and few of which allow reporters to search by the fields that would be most helpful — like name. A few lucky reporters with enough money might finally resort to proprietary database searches that run from $4 to $45 each search.

Photo provided by Ryan Thornburg
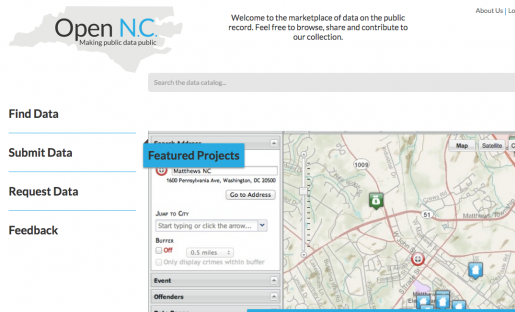
Our new data dashboard offers a different approach: pick a county to search, enter a name or an address, and choose which data sets to search. Any public record in our collection matching your query is shown in the results of that single search.
What Reporters Can Do: Automated Alerts
One of the most important roles that reporters play in a democracy is that of watchdog. And, as my colleague Ferrel Guillory is fond of reminding me, watchdogs are doing their job even when they don’t bark. Among the things required of a watchdog is something reporters increasingly find in short supply: time. They have to sit through a lot of mundane meetings, shuffle through paper copies of arrest reports every day, and follow a lot of leads that never pan out.

Photo provided by Ryan Thornburg
With the records in place, we’re starting to build an automated alert system to be on the lookout for names and places of interest to reporters that appear in new records entering the collection. Think local politicians or schools. Reporters will soon be able to save their searches, and upload to our system the names and address they want to watch. When a name or address matches a new record in the data, reporters will get an email alert. When no name matches, they can spend their time following other leads.
What Reporters Can Do: Follow Trends
The current beta version of the dashboard also shows summary information that might help reporters think of story ideas. For example, reporters can see which people have bought the most property or what categories of crimes have been reported in the last 30 days. They can also see which police officers have made the most arrests in the last month and which restaurants garnered the worst health inspection scores most recently.

Photo provided by Ryan Thornburg
We’re working with reporters now to build out more summary tables and simple data visualizations that can help them spot trends. Some editors have asked for interactive graphics they can embed into their websites, and we’re working on building those as well.
One of the most important aspects of the dashboard is our search for models that help highlight budding trends as more sophisticated ways of helping reporters and the communities they serve really understand when crime is up in an unexpected way, and when it is simply following patterns determined by day of the week, time of the year, and other factors. We hope these models will improve the quality of data driven news stories and illuminate the public debate in all communities.
FAQS
Where are you getting your data?
Our data comes directly from government agencies such as local law enforcement or state agencies. We are downloading some of the data that agencies provide in useable data formats. In most instances, though, we are scraping it off government websites that only provide it in HTML or PDF versions.
Who else is working on this project?
The code that runs the dashboard is being developed by Vaughn Hagerty, a journalist who developed data projects for Digital First Media’s newspapers and was recognized in 2009 for building the nation’s most innovative citizen media project that year. Bryan Davis, a graduate student in UNC’s Department of Statistics and Operations Research, is working on the trend analysis and building the models that will help alert reporters to potential story ideas. Davis has done data modeling for Bloomberg New Energy Finance in Beijing. In his spare time he plays with natural language processing in Chinese. Caktus Group, LLC., developed the main Open-NC.org website and played important roles in the early stages of the project. Many UNC students in the School of Journalism and Mass Communication and other departments have worked on the project in class, as paid employees and volunteers. They’ve done everything from design work to filing public records requests to industry research and communications for the project.
Who is paying for this?
The work on Open N.C’s data dashboard started with a course development grant from the Carolina Center for Public Service, which then led to a Knight News Challenge grant that has provided the bulk of the funding for this project. Google and the Office of UNC’s Provost provided the funding for the work being done this semester while I’m on research leave.
Is the code open source?
Not yet, but we’re going to clean it up and open the GitHub repo soon. Please let me know if you’re eager to contribute. Our core technologies are Python and MySQL on the back end and JavaScript on the user’s side.
Can I use the dashboard?
Initial dashboards have been launched in three North Carolina counties — Wake, New Hanover, and Buncombe. If you work in another North Carolina county, please contact me and we’ll move yours to the top of the list. The dashboard could probably be set up to work in other states. The most difficult aspect of launching a local version is not the technology but actually getting the data. Again, contact me if you’re interested.
How else might the dashboard be used?
We’re already working on using it to develop in-class exercises and enrich the student experience at UNC’s School of Journalism and Mass Communication. Statistics professors and graduate students are also looking at how they can use it to power their research interests.
How much does it cost to use?
Thanks to the generous support of the Knight Foundation and Google, nothing right now. I’m exploring how we might sustain it through a combination of new grants, the development of a membership fees paid by news organizations and the development of a consumer product.
Can anyone use it?
No. All the data in the dashboard comes from public records and I’m happy to talk with you about how you can get it. But I’m focused on helping professional journalists because I believe they play a special role in our shared civic life. I’m concerned about the financial sustainability and quality of professional journalism. But I’m also particularly happy to come speak with or train students and others interested in learning how to use public data to improve public debate.
Ryan Thornburg (@rtburg) researches and teaches online news writing, editing, producing and reporting as an assistant professor in the School of Journalism and Mass Communication at the University of North Carolina at Chapel Hill. He has helped news organizations on four continents develop digital editorial products and use new media to hold powerful people accountable, shine light in dark places and explain a complex world. Previously, Thornburg was managing editor of USNews.com, managing editor for Congressional Quarterly’s website and national/international editor for washingtonpost.com. He has a master’s degree from George Washington University’s Graduate School of Political Management and a bachelor’s from the University of North Carolina at Chapel Hill.
