This post was co-written by Neil Ashton, writer for the Open Knowledge Foundation’s School of Data blog.
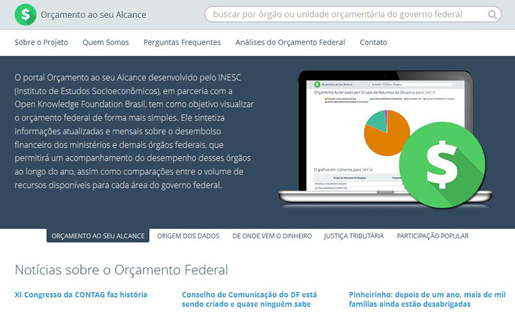
How can Brazilians participate in the allocation of public spending to ensure that it is used to construct a free, fair and sustainable society? With this question, Open Knowledge Foundation Brasil and the Brazilian NGO INESC (Institute of Socio-Economic Studies) set out in partnership to create Orçamento ao seu Alcance, a site which presents the Brazilian federal budget in an interactive and intuitive form.
We created Orçamento ao seu Alcance as a satellite site of OpenSpending. Using OpenSpending as our site’s database back end made it easier to construct visualizations and to host our source data in an open and accessible way.
What’s the project about?
Millions of Brazilians pay the taxes that fund the federal budget, but few actually understand it. Most are unaware of Brazil’s unjust regressive tax regime and of the scale of the losses to the public through misallocation and corruption. The information they need to understand these realities is simply not available in a comprehensible form. By building Orçamento ao seu Alcance, we hope to change that.
Orçamento ao seu Alcance’s development particularly focused on the issue of underspending. All Brazilian public bodies spend less money than is allocated to them, to varying degrees. The Ministry of Education, for example, left 16.3 percent of its budget (about U.S. $6.1 billion) unspent in 2012, and the Ministry of Culture only spent 47.5 percent of its budget in 2012. If Brazilians’ needs were really being met — if every Brazilian who wanted to study had access to great public schools, for example — this underspending would not be a problem. But that is far from the case; in fact less than 1 percent of schools have an ideal infrastructure (a problem we have explored previously). To explore and highlight the problem, we created a special-purpose data visualization.
How we used OpenSpending
Orçamento ao seu Alcance took data collected by SIGA Brasil, an aggregator for the many systems used by the Brazilian government to organize budget data, and added it to the OpenSpending database. Using OpenSpending freed us from creating our own database and allowed us to use the OpenSpending API to construct visualizations and a full-text search system.
Visualizing underspending
We designed our own graph to tackle the problem of underspending. The result is a time series graph that combines bars, lines, and an area. The site constructs such a graph for each budgetary unit, showing how its budget and spending compare for a given year.

The blue area in the graph represents the total budget — which, as you can see, changes over the year. Each red bar shows how much was spent in a particular month, and the red line tracks total spending. The distance from the red line to the tip of the blue area gives the share of the budget remaining to be spent. The amount remaining in December is money that is underspent.
This graph was built using NVD3, a JavaScript library with a collection of reusable charts made on top of D3.js. The data comes from OpenSpending via its Aggregate API.
Budget treemap
For the index page, we wanted to show a broad view of the budget across all public bodies. More than that, we wanted to show the amount of money used in each function and subfunction (e.g., Education and Basic Education). To do this, we used the OpenSpending treemap visualization.

OpenSpending allows you to create a treemap as a “widget” which can be simply dropped into a site. We used a modified version of the widget code with customized colors and a “back” button for improved navigation.
Searching
To help the user find public bodies, we implemented a search box with auto-complete using Twitter Bootstrap‘s typeahead library.

To make the search instantaneous for the user, we load all data entries as soon as the user enters the page. The OpenSpending Aggregate API once again helped with this, allowing us to get a list of all public bodies with a simple query.
Problems we had
We did run into a few problems using OpenSpending to build the site, though all of them could be overcome.
The Aggregate API only allows you to request one financial quantity (one measure) at a time. You can’t request both a budget quantity and a payment at the same time, for example. Our underspending graph ended up using three measures, requiring three requests. This is a performance problem. Because the API caches results, however, it ends up being OK — and there are already plans to support multiple measures in future versions, so this problem will soon be solved.
With the treemap visualization, our problem was that widgets are not customizable. They’re made to be dragged and dropped into a blog post or a newspaper article, not integrated into a site with its own design. To change the treemap’s colors and fonts, we had to use a modified version of the widget’s code.
Conclusions
We’re happy with how Orçamento ao seu Alcance turned out, and OpenSpending contributed a lot to its success.
For developers, OpenSpending made it possible to run the site without its own database and to publish its content in a sleek, cacheable form. For the project’s NGO supporters, using OpenSpending makes it possible to update the data without needing to deal with the site’s developers. Everyone is happy.
We hope that Orçamento ao seu Alcance will inspire other OpenSpending satellite sites that will help spread budgetary awareness around the globe.
Vitor Baptista is a developer passionate about public transparency and data visualization, helping to make more information available to empower people, one CSV at a time.
Neil Ashton writes documentation and web content to help the Open Knowledge Foundation’s projects reach a wider audience.

Wow guys! Incredible work, I’ll take a more close look, but you did a terrific job.