This is a guest post from Alexa Roman, a product designer in Los Angeles. It was originally published on Medium.
A simple guide to setting up analytics for startups and growth companies that have goals.
There are a million meaningless ways to discuss how your business is doing. When was the last time you tried to convince someone you were data-driven? Perhaps you’re actually referencing engagement as an indicator of success? Truly, we need to talk.
Setting up and running a successful metrics strategy comes down to one thing — predicting how much money you’re going to make. That’s it. Metrics don’t matter. Money matters and the only reason to care about metrics is to follow the money: when you make it and when you lose it. Side note: I get that some organizations are not about money. Just mentally find/replace money with your own currency — volunteers, petitions, whatever matters most.
Because I can’t have another conversation about why Google Analytics isn’t enough, here’s how I execute metrics from beginning to end.

Step One: Pirate Metrics
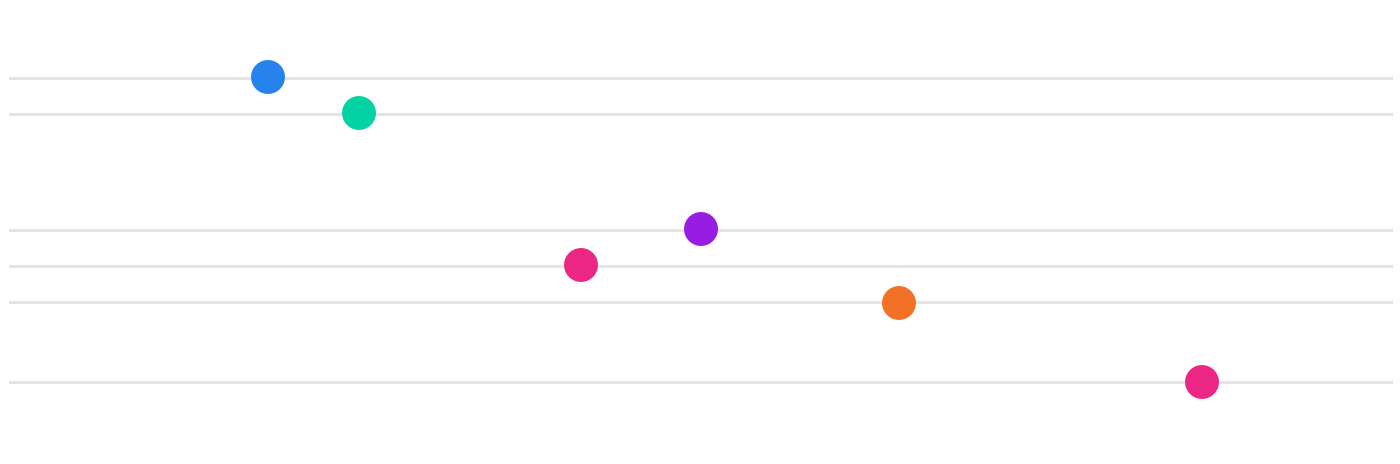
Hopefully, most of you have heard of Dave McClure’s pirate metrics framework. If not, here it is. Learn it. Love it.
Personally, I love pirate metrics because they limit your choices for key metrics and guide your eye to REVENUE. McClure’s framework is designed to ease you into fewer (but more meaningful) metrics. It’s simply a starting place meant to help you define your key metrics. Key metrics are numbers that indicate your business is or soon will be self-sustaining. Read: revenue-generating or indicators of revenue.

Dave McClure’s pirate metrics redrawn by me because lord, his graphics are terrible. Yes, I know he does it on purpose.
Your product doesn’t have to be linear (like a funnel, for example) for these metrics to make sense. Start with revenue and back up into acquisition and activation, then continue to retention and referral. Don’t obsess about retention or referrals if you haven’t launched yet. Also, why haven’t you launched yet?

Step Two: Defining Events
Now that you’ve got your key metrics, you need to define the exact moment each of those happens. I always advise founders to pick the latest action that counts for that stage. For example, say you’re talking about acquisition for Airbnb — the latest stage of acquisition might be that they landed on a listing. That means your key acquisition metric is # of UNIQUE views on any individual listing from new or non-registered users.
If I continue with that example. Airbnb’s key metrics could look like this:
Acquisition — # of new unique views on any listing from new or non-registered users
Activation — # of people who click book AND potential booking $ revenue
Revenue — $ of total bookings minus $ of refunded bookings
Retention — # of repeat bookings per user
Referral — # of new user bookings that occur because a listing was shared
In that example, homepage views are not very relevant. Bounce rate is also not relevant. Nor is engagement. If I land on Airbnb’s website via a link from a friend and book the first listing and am happy with it and then, return and book again, they nailed it. Money in the door. Little engagement required.
Now that you’ve defined the moments that matter for your revenue, you can define the exact events. This is crucial, especially as a company grows and more than one person is reading analytics. It needs to be clear what a metric means to a company and how it is tracked down to the moment.
I did a project with Marc Love when I was at Carbon Five and he suggested all the metrics events should be named as follows:
[Past tense verb] + [Descriptive noun]
For example, “Requested booking” which when camelcased or whatever your preferred styling is, could become:
requestedBooking
If you have multiple users doing similar actions, you may want to add a user type in there. For example:
hostConfirmedBooking
Going back to your pirate metrics, write these exact events next to each one. What pages/flows are they tracked on? Is there a button someone is pressing or a field they are inputting? What is the exact moment that that metric counts?
Don’t underestimate the importance of this activity. It is not something to be passed onto your engineering team with a shrug. It requires collaboration and consensus building. This will become the foundation on which all of your reports and intel are based. Treat it with care. If you’re not clear on this, no one will be. Poorly tracking your metrics is almost worse than not tracking them at all.

Step Three: Choosing Tools
I recommend implementing at least two analytics platforms. The reason is that they will make you question your data. If you have one tool you’re reading all reports from, it’s easy to just trust that it’s right. When you have two and they disagree with each other (which they will), you want to know why and that’s when you ask hard questions, fix problems and try new approaches.
My favorite analytics tools are Mixpanel, Kissmetrics and Optimizely. Sometimes, Heap. Here’s a short breakdown of why.

Mixpanel and Kissmetrics
I’m torn between Mixpanel and Kissmetrics. I think both are great tools, mainly because they provide deep user journey tracking. You can dive into individual user journeys and see moment to moment what they are doing. In my experience, this has given the team incredible insight into where we were losing people and how we screwed up the tracking. Google Analytics is starting to do this, but is no master at it yet. Also, GA has a habit of just throwing data at you. In fact, overmeasuring and looking at way too many metrics can cause you to focus on the wrong thing.
Both Mixpanel and Kissmetrics have built their tools around conscious measuring meaning that it’s not important to track everything. I love that events must go through a deployment cycle because they are just as important as features. You should be testing events like you test features.
Heap
The reason to install Heap is that if you screw up your metrics, which you undoubtedly will, you can retroactively pull those numbers. You can also see emergent patterns you never would have thought to track. The challenge with Heap is that events are implemented with a GUI, not with the help of a developer which means it’s super easy to confuse what you’re tracking. I would not recommend using Heap as a core analytics tool but more as a bridge or emergency tool.
Optimizely
Oh Optimizely, how I love thee. Optimizely is for A/B and multivariate tests. Three things to love about it:
1) They have statisticians on staff whose intel is built in. The Optimizely dashboard will automatically tell you when your test is done.
2) They have a clickable UI that allows you to edit messaging or imagery so you can run very simple tests without annoying development
3) They’re not trying to be something else. This tool is very simple. I hope it stays that way.
Of course, there are a few challenges with Optimizely. First, they auto-load in engagement as your first metric. Please remove it right away. Second, they load in your metrics alphabetically for no good reason. If you want your flow to appear in the order the user sees it, you have to number your metrics: 1clickedBook, 2submittedCreditCard. Third, it doesn’t play well with single page apps which is substantial considering that’s how we’re building a lot of apps right now. Regardless, you can use Optimizely for routing and measuring your A/B tests. Watch Sue Anna Yeh talk about how here.
Other tools
There are many other tools. Keen.io, Chartio, Google Analytics to name a few. Keen.io is developer-centric which is a great thing but hasn’t worked as well for me on projects where too many people are not technical. In my opinion, Google Analytics is only ok for running small business website analytics. I love Google in general, but that platform is just such a mess. Please don’t use it as your core data reader.
Again, you can implement most analytics and testing platforms using Segment. Check out Segment’s list of integrations for a sense of what else is out there. With all these tools, work with a Lead Engineer to collaboratively define how you’ll use them. Engineers are a tremendous asset when it comes to sourcing and understanding data. Get them involved early and often.

Step Four: Analyzing Data
The most important part of measuring is how you read and question the data. Misreading your data can lead to ill-informed product choices which will piss off your customers and your employees.
When you look at your data, your goal is to get the most objective view possible. Since founders are inherently delusional, I suggest setting up some consistent practices that can reduce bias. Here are three approaches you could take:
One way is to have an analytics team. This is a luxury mostly gained at a growth stage, but if it’s possible for your organization, by all means, this is a great asset to your team. You can use these strategists to stay on top of the new tools and techniques, to collaborate with you on what to measure and to read reports alongside you. If there’s any disagreement, it’s worth uncovering whether it’s the humans who set up the tools or the humans reading the reports.
Two is to create an analytics working group made up of employees from many disciplines. For example, an engineer, a designer, a marketer and a founder. This team would be tasked with reviewing the analytics strategy (i.e. your pirate metrics, exact event moments and tools) every month as well as reviewing reports every week to find bugs in tracking and opportunities to pass along to the broader product team. I would highly suggest making this a transparent and open process so that anyone could attend. One hour every Monday would be both sufficient and invaluable.
Three is to pin up or send metrics reports to your whole team once a week asking for feedback and second looks. This is the weakest way to reduce bias because it’s unlikely anyone will challenge your read, but it is certainly possible. You might find generating a new surprise metric or including user quotes can help people engage with these reports. Empowering anyone to question your reports is crucial to finding gaps and errors.
Lastly, in addition to the long-term metrics, you should also be running many, many short-term A/B and multivariate tests. These will surface new tracking issues as you implement new features and interaction paths. You’ll undoubtedly screw up your existing metrics paradigm and need to rethink it. This is where the analytics team or committee can be most helpful — planning for flexibility and having many eyeballs on measurements as you shift the data sources.

Step Five: Taking Action
Now that your data tracking is up and running, you have some information you can use.
Before you can use the data you’ve gathered, your team needs to
1. Be aware of what data has been captured
2. Be looking at the same reports in the same time intervals (probably weekly reports)
3. Agree on what you’ve learned
Those seem easier than they read. If you’re getting the team involved to dummy check reports, then hopefully number one is taken care of. You can achieve the second bullet by continually communicating how to pull a report, including what to look at and over what amount of time.
For the third piece, you’ll have to develop a team practice. In the past, I’ve run learning workshops to gather what everyone is drawing from data and then, simply grouping it:
Synthesis learning workshop
- Review weekly analytics report and any A/B test reports
- Give everyone post-its and sharpies to draw conclusions from the reports
- Everyone silently writes what they’ve learned from the reports
- Then, each person pins up their learnings and the facilitator groups them, finding common themes
There will undoubtedly be some debate about what some of the data means. As a founder or product lead, it’s your call what to do, but I‘d try to get to the bottom of that misunderstanding — whether that means talking through it or actually changing how something gets tracked. This is where the exact event names and times really come to your aid.
Once you have your learnings, you can generate what you want to learn next. You can run the same process: individually write on post-its, talk through them, group them and then dot vote on which to go after first or just make a call as the product visionary. This is how experiments come to life.
You can also run six-up sketching workshops or experience mapping activities to uncover new ideas. As long as the whole team is staying continually and deeply informed, they will instinctively develop new product value into their work.
. . .
I’d be remiss not to mention Intercom, which I love and just good old conversations with people who use your product. When you start looking at your data with a critical eye, talking with your customers can help you understand the why behind the what. Quant + Qual for the win.
In summary, have clear, shared goals. Make sure those goals involve a currency of some kind and chase them with measured accuracy. Don’t hesitate to reach out if you have questions or if you want to pay for me to get my MBA.
![]()
Alexa Roman is a product designer in Los Angeles.
