This post was originally published on the Webcredible blog and is republished here with permission.
I’ve been teaching our Google Analytics training course for two years now, and it’s always been surprising to me what reports are not being used by those who attend the course. Given that GA is so useful in providing insights into how your audience are using your website, it surprised me that oftentimes students had not even heard of some of its most useful features.
In truth, the main reason these useful reports aren’t being used is that analytics is generally just one aspect of someone’s day-to-day work, often only being used to rush together a quick report (e.g. a summary of landing pages and page views) to satisfy higher management’s demands for metrics.
While you may not gain more time to take a detailed look at your website’s analytics, the below reports should help you to have a quick way of seeing some new, more useful trends around how users interact with your site. Here are five reports you should start using more.
1. Segments
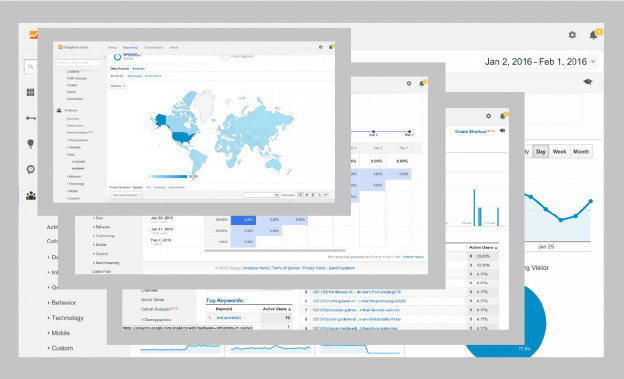
It’s true! A lot of people are really underusing Segments, despite how useful they can be. Segments help you to break down your audience so you’re looking at the right data. This can be anything from limiting the data you’re looking at to being country-specific — e.g. only UK traffic if you’re a UK business — or only seeing data from those who have completed your site Goals. These will help you to gain more specific insights into what users are doing and, more importantly, where they might be running into problems.

Fig 1. Click on the section above your report to adjust what Segment(s) you’re viewing. By default, Analytics will show you ‘All Sessions’
Creating a segment is easy and Google even provides many standard ones you’ll likely want to take a look at. They’ll help you to quickly and easily answer questions like:
- How are users finding a particular page?
- What channel is most successful in converting visitors?
- How many pages are conversions looking at and going through before they complete your site goals?
By knowing the above, you can adjust your website to convert more effectively.
2. Navigation Summary
Let’s say you want to find out where most users go next after having looked at a particular page, how can you find out quickly? Up next to ‘Explorer’ you can click on Navigation Summary to see a summary of the path people take to get to the page and where they go next. It’s a good way to see if people are following the user journey you would expect. If there’s another page you want them to be going to, it’s important to make sure they’re going there!
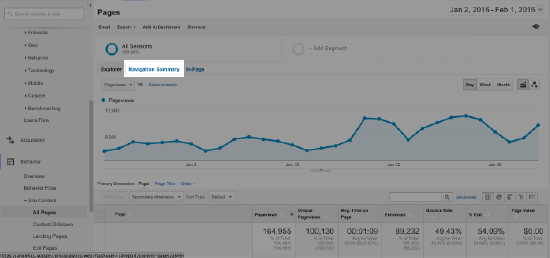
Fig 2. Above your page report, click on Navigation Summary, next to Explorer
If you’re seeing issues with your site, it might be worth using something like http://bounceapp.com to summarize your findings in a quick, visual way to communicate effectively with time-constrained management.
3. Events
It’s probably not your fault if you don’t have any Event tracking set up on your site. While they’re useful for tracking interactions that take place within a page (think video plays, downloading pdfs, etc.) they require extra code that needs to be added to your site. Developers are busy people, so it can be difficult to not just find time for yourself, but also within your website development team to implement the code.
Nevertheless, Events can help you to track important micro-transactions on your site. For example, it’s useful to know if many people sign up to your newsletter and subsequently purchase your goods. If that’s the case, you can see that your newsletter activity is effective in converting your visitors. It can provide guidance for other activity as well.
Google’s Tag Manager provides you with a tool to create your own tags, without having to consult your development team. I’ll be running a skill swap in February that’ll help teach you to do this, so come by and I’ll be happy to answer any questions you have (it’s free to attend!).
4. Goals Funnel
Every website has something that it wants its users to do. It can be to buy something, to set up an account, to provide personal information, to get in touch, or even just to get information. To better track whether a site is succeeding in its required goal, Analytics allows you to set up Goals and a Goals Funnel.
Access the funnel by clicking on Conversions>Goals>Funnel Visualization. The funnel can track the various stages that people need to go through to complete a goal (e.g. providing information in a checkout process), and can help you to see where people may be falling away. If one step has a high user exit rate, it’s worth investigating how to change the page to optimize your process.
Even if your site only has a form to fill out, you can create a funnel by setting up virtual page views that get fired off when someone fills in their details. It’ll help you to track what information people want to give, as well as what they don’t feel comfortable divulging.
5. User Flow
On its own, the User Flow report can be tricky to use, but when you combine it with segments, it’ll start to provide a clear picture of how certain users are going through your site and Funnel.
For example, it might seem great at first that you’ve got a 20 percent conversion rate in your Goal Funnel, but if only 1 percent of your traffic can even get to your funnel (e.g. checkout page) in the first place, it’ll give you insights into what needs to change on your site.
The above reports will give you plenty of insights into what users are doing on your site, but they’ll struggle to explain why they’re doing it. It’s worth pairing UX techniques and user testing with GA to come up with answers to the latter. If you don’t feel you have the time or budget for a full round of user testing, a tool like https://www.inspectlet.com will allow you to see users using your site.
![]() Mark Cunnah is a user experience analyst for Webcredible, a London-based user-centered design agency.
Mark Cunnah is a user experience analyst for Webcredible, a London-based user-centered design agency.
